| Microsoft Office 2000/Visual Basic Programmer's Guide | |
PivotTable reports provide a means to view a single set of data in a variety of configurations. Like a query, a PivotTable report can answer a question about a data set: Which customers provided the most sales for the first quarter of this year? In which country was a particular product most popular last year? How well did a particular sales representative do in Europe for the past two years?
If you're skilled at building queries, you can answer each of these questions with a separate query. The advantage of the PivotTable report, however, is that once you've defined the data set, you can "pivot" the data to answer all of these questions with a single data set. For most users, this is easier and more intuitive than building a query, especially when the PivotTable report combines data from multiple tables. It's also easy to build PivotChart reports from PivotTable reports and publish the data to a Web page. And, because PivotTable data is cached in memory, PivotTable reports provide extremely fast querying.
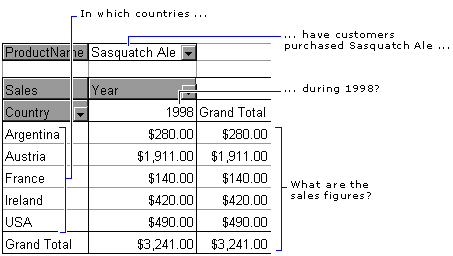
The simple PivotTable report in Figure 15.1 answers the question, "In which countries have customers purchased the product Sasquatch Ale so far during 1998, and what are the sales figures?" You could easily modify this PivotTable report to answer the same question for other products, or to view sales for a different year, or to view sales only for European countries.
Figure 15.1 PivotTable Report Showing Sales Data for a Product, by Country, for a Single Year

Not every question about a data set can be answered by a PivotTable report. Because the data fields in a PivotTable report are always calculated fields, PivotTable reports are ideal for summarizing numeric data, such as sales data. You can display the sum; the count of data items; the average, minimum, and maximum values; and the product, standard deviation, or variance of a set of values. You can also define custom-calculated fields to add to a PivotTable report. However, you can't display text in the data area of a PivotTable report. For example, you can't use a PivotTable report to display a grid of text values such as "True," "False," or "Unknown" (although you could represent these values numerically and provide a key). If you need to display text, consider creating a query in a database, displaying the data as a list in Excel, or using a grid control to display the data on a form.
You create and manipulate PivotTable reports in Excel. Although Access includes the PivotTable Wizard, which you can use to create an embedded PivotTable report in a form, you can't edit a PivotTable report directly within Access. When you choose to edit the PivotTable report, Access launches Excel so that you can edit the PivotTable report within Excel.
In order to create a useful PivotTable report, you need to understand and define the set of data that should appear in the table. Depending on where your data is stored, this may be the most difficult part of creating a PivotTable report. If your data is stored in an Excel worksheet or worksheets, you can define a range or ranges as the data source for the PivotTable report. If your data is stored in an external database, you need to define a query that extracts the data that you want. See "Creating a PivotTable Report from an External Data Source" later in this chapter for more information.
For example, if you want to create a PivotTable report that displays sales data by quarter, you need to base the table on a query that groups records by quarter. A well-designed database is more likely to store the date that a given order was taken than the quarter, because you can easily build a query that displays the data by quarter if you've stored the date. However, you need to create this query before you can display quarterly information in the PivotTable report.
The following SQL statement defines calculated fields that parse the order date from the Northwind Orders table to return the quarter and year in which the order was taken.
SELECT
   Orders.OrderID,
   DatePart('q',[OrderDate]) AS Quarter,
   Year([OrderDate]) AS [Year]
FROM Orders;
Although PivotTable reports are fairly easy to use once you understand the concepts behind them and the data they contain, they may still be confusing to many users. As a developer, you can simplify PivotTable reports for users by providing a set of options for viewing PivotTable report data. For example, you might create a solution that includes a form for users who need to look at just a few variations of PivotTable report data, and configure the PivotTable report for them based on which option they choose. The Northwind.xls sample file in the ODETools\V9\Samples\OPG\Samples\CH15 subfolder on the Office 2000 Developer CD-ROM includes a form that demonstrates ways to control user interaction with a PivotTable report.