| Microsoft Office 2000/Visual Basic Programmer's Guide | |
You can supply data to the Chart control by linking, or binding, the chart to a data source (bound data), or by programmatically providing data directly to the chart (literal data). Both methods are discussed in this section.
When you create a Chart control in Microsoft Excel or Microsoft Access, the Microsoft Office Chart Wizard is used to help you link the chart to its source of data.
The easiest way to create a data-bound Chart control is to create the chart by using Excel and then the Publish as Web Page dialog box to specify that the Web page should have interactivity with chart functionality. For more information about using the Publish as Web Page dialog box, see "Using Microsoft Excel to Create a Spreadsheet Control" earlier in this chapter. When you use this technique to create a Chart control, both the chart and the data it is based on are published to the Web page. The data for the chart is saved in a Spreadsheet control.
Once you have created a Chart control by using the Publish as Web Page dialog box, you can further customize the page in Access by using the data access page designer. For example, you could open the page by using the Edit Web page that already exists object in the Pages object list in the Database window. You could then hide the Spreadsheet control and add text box controls tied to the Spreadsheet control that would allow a user to change the data supplied to the chart and see those changes immediately displayed in the Chart control.
For an example of a chart published from Excel and modified in Access, see the SimpleChartExample.htm file in the ODETools\V9\Samples\OPG\Samples\CH12 subfolder on the Office 2000 Developer CD-ROM.
You can create a Chart control on a data access page in Access by clicking the Office Chart tool in the toolbox and then clicking the place on the page where you want the control to appear. Once you have placed the control on the page, the Microsoft Office Chart Wizard walks you through the steps necessary to bind the chart to a table or query in the database or to a PivotTable List control on the same data access page. Unlike the Chart control that is created by using the Publish as Web Page dialog box in Excel, the Chart control created in Access does not place a Spreadsheet control on the page. Instead, the chart is linked directly to a data source in the database, and the chart displays the most current data from the underlying data source. When the data access page is viewed in Internet Explorer, the chart always displays the most recent data from the database. However, if the data in the database changes while the page is being viewed in Internet Explorer, the change is not immediately reflected in the Chart control on the Web page, unless the user viewing the data in Internet Explorer refreshes the page.
The Chart control exposes a wide variety of objects you can use to specify how the chart will display data when it is viewed in Internet Explorer. Manipulating these objects programmatically allows you to customize the behavior of the control.
If you want to write code to manipulate the Chart control when it is viewed in Internet Explorer, you must do so by using VBScript or JScript code. If you are going to display the page as a data access page within Access, you can write VBA code to manipulate the Chart control's objects. If you are in the process of learning to work with script in a Web page, you may find it easier to write VBA code in Access and then revise that code to run as VBScript code in the page when the page is displayed in Internet Explorer.
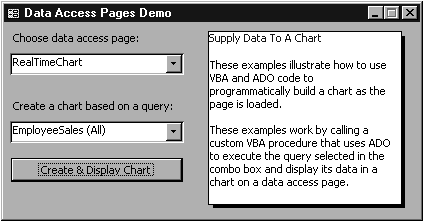
The Developer Solutions (Solutions9.mdb) sample database in the ODETools\V9\Samples\OPG\Samples\CH05 subfolder on the Office 2000 Developer CD-ROM contains a number of data access pages that you can examine to see how these pages are constructed and how they work when viewed in Internet Explorer. In addition, the Developer Solutions database contains the DataAccessPages form (shown in Figure 12.8), which shows how to use VBA code to work with data access pages within Access. The DataAccessPages form and its related code illustrate how to use VBA code to fill a Chart control with data from an ADO data source.
Figure 12.8 Form to Launch Data Access Pages from Within Access

In the DataAccessPages form, the VBA code in the Click event procedure for the Create & Display Chart command button calls the BuildCustomChart procedure, passing it both the name of the query to use as the data source for the chart and the text that appears as the chart heading. The following code sample shows the portion of the BuildCustomChart procedure that executes the query and adds the data to the Chart control:
' Execute the query supplied in the strQueryName argument
' and format the data to be charted as a tab-delimited string.
rstRecords.Open Source:=strQueryName, _
   ActiveConnection:=CurrentProject.Connection
With rstRecords
   .MoveFirst
   Do While Not .EOF
      varCategories = varCategories & .Fields(0).Value & vbTab
      varValues = varValues & .Fields(1).Value & vbTab
      .MoveNext
   Loop
End With
' Remove trailing tab character.
varCategories = Left$(varCategories, Len(varCategories) - 1)
varValues = Left$(varValues, Len(varValues) - 1)

' Fill the chart with data.
With dapPage.Document.ChartSpace1
   .Clear
   .Charts.Add
   .Charts(0).SeriesCollection.Add
   .Charts(0).SeriesCollection(0).Caption = strCaption
   .Charts(0).SeriesCollection(0).SetData .Constants.chDimCategories, _
      .Constants.chDataLiteral, varCategories
   .Charts(0).SeriesCollection(0).SetData .Constants.chDimValues, _
      .Constants.chDataLiteral, varValues
   ' Create a bar chart.
   .Charts(0).Type = .Constants.chChartTypeBarClustered
   ' Format the bottom chart axis values as currency.
   .Charts(0).Axes(.Constants.chAxisPositionBottom).NumberFormat = "$#,##0"
End With
For more information about programmatically filling a Chart control with data, see the next section, "Working with the Chart Component's Object Model."