| Microsoft Office 2000/Visual Basic Programmer's Guide | |
When you are working with the Chart control, the top-level object in the object model is the ChartSpace object, which represents the chart itself. The control has a collection of Chart objects contained in the Charts collection. You add a Chart object to a Chart control by using the Add method of the Charts collection. You specify the type of chart (bar, line, pie, and so on) by using the Chart object's Type property.
You fill a chart with data designated in one or more series; each series consists of categories and values. For example, to fill a chart with data about employee sales, you could add a series that charts employee names as the categories and sales amounts as the values. Each series in the chart is represented by a SeriesCollection object. You specify the data to be used for the desired categories and values by using the SeriesCollection object's SetData method. You can then specify various properties of the SeriesCollection object by using its properties. For a complete example that charts employee sales, see the BuildChart procedure in the EmployeeSalesSummary.htm file in the ODETools\V9\Samples\OPG\Samples\CH12 subfolder on the Office 2000 Developer CD-ROM.
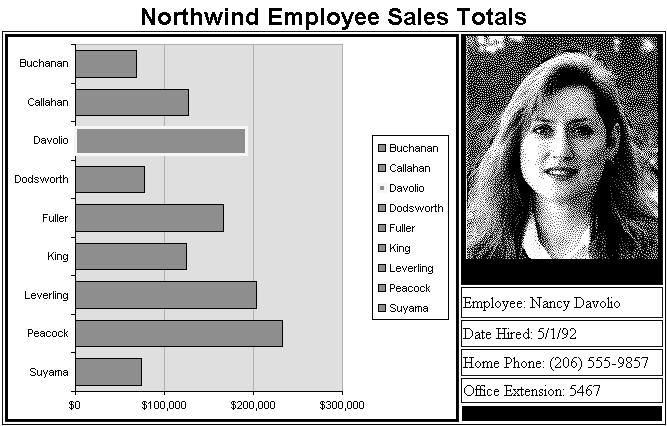
The EmployeeSalesSummary.htm sample file illustrates how you can use VBScript code to create and manipulate a Chart control on a Web page. Figure 12.9 shows this sample file displayed in Internet Explorer.
Figure 12.9 Using a Chart Control on a Web Page

The VBScript code in this .htm file builds the Chart control in a very similar manner to that shown in the BuildCustomChart procedure in "Programmatically Providing Data to a Chart Control" earlier in this chapter. The interesting part of the EmployeeSalesSummary sample is that it illustrates how to manipulate the chart and related data displayed on the page depending on how the user interacts with the chart. In this example, as the user moves the mouse pointer over different bars on the chart, the employee's picture and related information is displayed in the area to the right of the chart.
What makes this example work is VBScript code in the Chart control's MouseMove event procedure. The code in the event procedure detects the bar on the chart that the mouse pointer is over, retrieves the corresponding employee's record from the database, and then displays the employee's information on the page. As shown in the following procedure, the RangeFromPoint method of the ChartSpace object is used to determine which bar on the chart is currently under the mouse pointer:
Sub ChartSpace1_MouseMove(lngMousePosition)
   Dim objSelection

   On Error Resume Next

   Set objSelection = _
      ChartSpace1.RangeFromPoint(lngMousePosition.x, lngMousePosition.y)

   ' If the mouse pointer is not over one of the bars in the
   ' chart, exit the procedure.
   If TypeName(objSelection) <> "WCPoint" Then Exit Sub

    ' Display data for selected employee in display area to the
   ' right of the chart.
   SetEmployeeInfo objSelection.Index

   ' Format the border of the previous bar on the chart.
   If Not(gLastSelection Is Nothing) Then
      gLastSelection.Border.Weight = 1
      gLastSelection.Border.Color = "Black"
    End If

   ' Highlight the current bar on the chart and save the object
   ' just highlighted so it can be identified when the selection
   ' changes again.
   objSelection.Border.Weight = 3
   objSelection.Border.Color = "Yellow"
   Set gLastSelection = objSelection

   On Error GoTo 0

   Set objSelection = Nothing
End Sub
The VBScript code in the MouseMove event procedure calls the SetEmployeeInfo procedure. The SetEmployeeInfo procedure retrieves the employee record from the Northwind sample database (Northwind.mdb) and displays that information on the Web page.
Sub SetEmployeeInfo(intEmployee)
   Dim rstSingleRecord
   Dim strSQL

   If Len(intEmployee) > 0 Then
      ' If this is the same employee that is already highlighted,
      ' then leave now. There is no need to replace the current
      ' information.
      If strCurrentName = gastrNames(intEmployee) Then Exit Sub

      strCurrentName = gastrNames(intEmployee)

      ' Create a new ADO Recordset object containing a single record
      ' for the employee named in the strCurrentName variable.
      Set rstSingleRecord = CreateObject("ADODB.Recordset")
      strSQL = "SELECT * FROM Employees WHERE LastName = '" & strCurrentName & "'"
      rstSingleRecord.Open strSQL, gcnnConnection, 3, 1

      ' Fill the remaining cells in the table with additional information
      ' about the selected employee.
      strEmployeeName.innerText = "Employee: " _
         & rstSingleRecord("FirstName") & " " & rstSingleRecord("LastName")
      strHireDate.innerText = "Date Hired: " & rstSingleRecord("HireDate")
      strPhoneNumber.innerText = "Home Phone: " & rstSingleRecord("HomePhone")
      strExtension.innerText = "Office Extension: " & rstSingleRecord("Extension")
      imgEmployeePicture.src = strPhotoPath & Trim(strCurrentName) & ".gif"
   End If

   Set rstSingleRecord = Nothing
End Sub
For complete documentation of the Chart control's object model, see the Msowcvba.chm Help file, which is located in the C:\Program Files\Microsoft Office\Office\1033 subfolder.
Note The path to the Msowcvba.chm Help file reflects the language ID folder (1033) for U.S. English language support in Office. The language ID folder below C:\Program Files\Microsoft Office\Office differs for each language.