
When your application is running, Microsoft Access keeps track of each time one procedure calls another. If you’re tracing the progress of your code and want to find out which procedures have been called, press CTRL+L or click Call Stack on the View menu. Or, in the Debug window, click the Calls button to the right of the Procedure box.
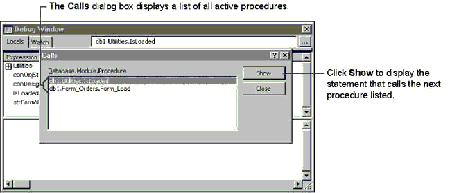
The Calls dialog box displays a list of all active procedure calls—the procedures in an application that are started but not completed. The most recently called procedure appears at the top of the list.
The Calls dialog box is especially helpful if you want to trace nested procedures. For example, an event procedure can call a second procedure, which can call a third procedure—all before the event procedure that started this chain has finished. In the following illustration, the Calls dialog box lists two active procedure calls: the Order form’s Load event procedure has called the IsLoaded Function procedure.

The Calls dialog box lists all the active procedure calls in a series of nested procedure calls. It places the earliest active procedure call at the bottom of the list and adds subsequent procedure calls to the top. The information given for each procedure includes the setting of the database’s ProjectName property, the name of the module that contains the procedure, and the name of the called procedure.
You can use the Show button to display the statement that calls the next procedure listed in the Calls dialog box. That statement is highlighted by a green pointer that appears in the margin of the Module window. If you choose the current (top) procedure in the Calls dialog box and then click Show, Visual Basic displays the current statement (the statement at which execution is suspended).