MDAC 2.5 SDK - OLE DB Programmer's Reference
Chapter 21: OLE DB for OLAP Concepts
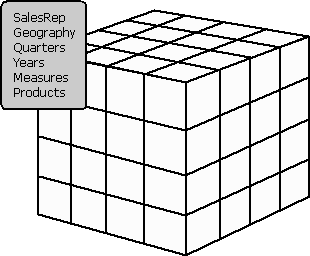
The SalesData cube example represents the simplest cube concept and contains six dimensions. Examples throughout this guide will refer to this example.

SalesData has the following six dimensions:
Consider a dataset on this cube that looks like this:
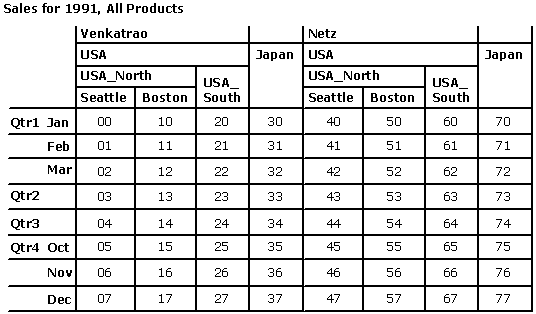
The characteristics of this dataset are as follows:
| SalesRep | Geography | Quarters | Years | Measures | Products |
| Director NA | All | Year | 1989 | Sales | Computers |
| Netz | North America | Qtr1 | 1990 | PercentChange | Expansion Cards |
| Venkatrao | Canada | Qtr2 | 1991 | BudgetedSales | Floppy Drives |
| Director Europe | USA | Qtr3 | 1992 | Ceiling Fan | |
| Ng | Canada_East | Qtr4 | 1993 | 75W Light Bulb | |
| King | Canada_West | January | 1994 | AC Adapter, 12V | |
| USA_North | February | 1995 | AC Adapter, 6V | ||
| USA_South | March | 1996 | Printers | ||
| USA_West | April | 1997 | Scanners | ||
| USA_East | May | 1998 | |||
| Boise | June | 1999 | |||
| Boston | July | 2000 | |||
| Calgary | August | 2001 | |||
| Cookstown | September | ||||
| Houston | October | ||||
| Los Angeles | November | ||||
| Miami | December | ||||
| New York | Week1 | ||||
| Ottawa | Week2 | ||||
| Pembroke | Week3 | ||||
| Seattle | Week4 | ||||
| Shreveport | |||||
| Toronto | |||||
| Vancouver |
SalesData Geography Hierarchies
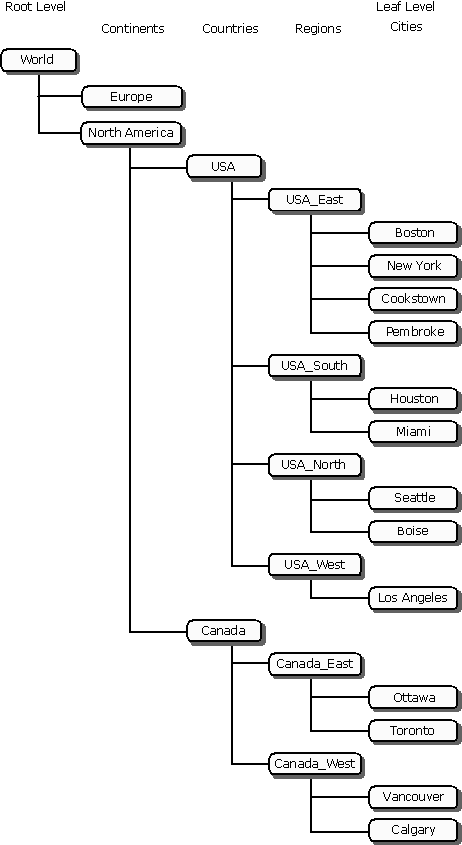
| Geography.All | Geography.NorthAmerica |
| Geography.Europe | USA |
| Geography.NorthAmerica | USA_East |
| Boston | |
| New York | |
| Cookstown | |
| Pembroke | |
| USA_South | |
| Houston | |
| Miami | |
| USA_North | |
| Seattle | |
| Boise | |
| USA_West | |
| Los Angeles | |
| Canada | |
| Canada_East | |
| Ottawa | |
| Toronto | |
| Canada_West | |
| Vancouver | |
| Calgary |
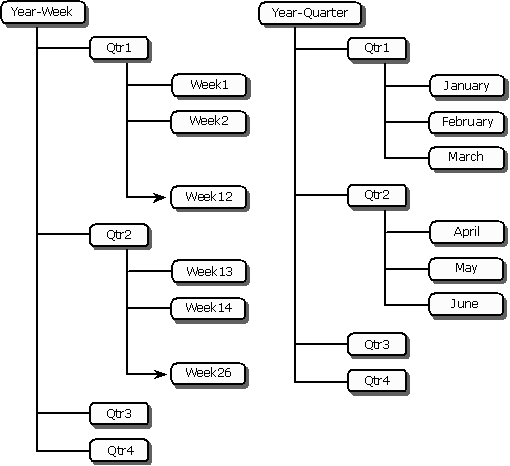
| Year-Week | Year-Quarter |
| Qtr1 | Qtr1 |
| Week1 | January |
| Week2 | February |
| Week3 | March |
| through Week12 | Qtr2 |
| Qtr2 | … |
| Week13 | |
| … |
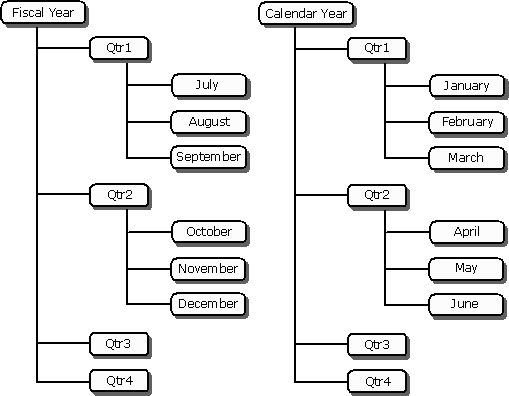
| Year-Calendar | Year-Fiscal |
| Qtr1 | Qtr1 |
| January | July |
| February | August |
| March | September |
| Qtr2 | Qtr2 |
| … | … |