The Trace Provider tool is new to the Microsoft® Data Access Components for version 2.5. The tool and its documentation are still under development and subject to change.
An application interacts with a data source by calling interfaces supported by a particular provider. The Trace Provider tool transparently intercepts those calls and outputs a log file containing the call, return value, values of relevant input and output parameters, and the elapsed time for the call. Any developer or tester who is knowledgeable in the OLE DB API, and who is trying to explore the behavior of one or more providers, can use the Trace Provider tool.
You do not need to modify your application or your provider in order to use the Trace Provider tool. You can trace one or more providers, processes, and threads at once. The only caveat is that the small amount of time necessary to output a log entry will slow the operation of your application, which can hinder debugging problems associated with timing.
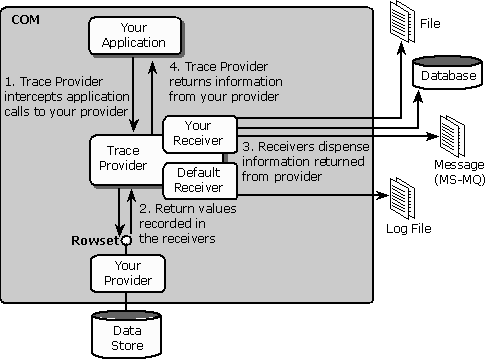
The following illustration shows the relationship between your application, the provider, the data source, and the log file. The trace output is sent to a file by default; however, if you write your own receiver, you might write the output to a file, database, or message queue, for example.

The Trace Provider implements all OLE DB interfaces, in addition to a few basic COM interfaces, such as QueryInterface. The tool reports on each interface and each method of that interface that is called by your application.
The Trace Provider generates two packages from each call by the client application. One package is sent to the receiver for recording, and the other is passed on to the provider. When the provider attempts to return to the client application, the Trace Provider produces another two packages: one is passed on to the application and the other is again delivered to the receiver. The receiver manipulates the information in order to display it appropriately.