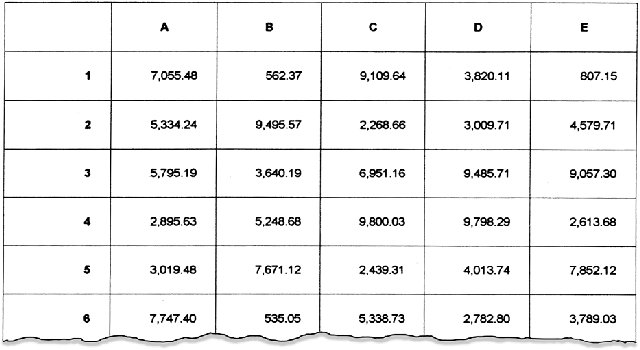
Listing 9.12 contains a subroutine that demonstrates how to format a single page from a spreadsheet, including the gridlines and random values for the data.
Listing 9.12: Sample01 Routine in Print
Private Sub Sample01()
Dim g As Single
Dim i As Single
Dim j As Single
Dim t As String
For i = 1440 To 1440 * 10 Step 720
Printer.Line (1440, i)-(1440 * 7, i)
Next i
For i = 1440 To 1440 * 7 Step 1440
Printer.Line (i, 1440)-(i, 1440 * 10)
Next i
g = (720 - TextHeight(Cell: G20)) / 2
Printer.Font.Bold = True
For i = 1 To 5
t = Chr(Asc(@) + i)
Printer.CurrentY = 1440 + g
Printer.CurrentX = 1440 + 1440 * i + (1440 - Printer.TextWidth(t)) / 2
Printer.Print t
Next i
For i = 1 To 17
t = FormatNumber(i, 0)
Printer.CurrentY = 1440 + 720 * i + g
Printer.CurrentX = 2880 - Printer.TextWidth(t) - g
Printer.Print t
Next i
Printer.Font.Bold = False
For i = 1 To 5
For j = 1 To 17
t = FormatNumber(Rnd * 10000, 2)
Printer.CurrentY = 1440 + 720 * j + g
Printer.CurrentX = 2880 + 1440 * i - Printer.TextWidth(t) - g
Printer.Print t
Next j
Next I
Printer.EndDoc
End Sub
The routine begins by declaring some local variables: g is used to hold a gap value, i and j are general-purpose loop counters, and t is a temporary string variable used to hold data prior to printing.
The first real work is to draw 20 horizontal lines starting at 1 inch (1440 twips) and stopping at 10 inches (1440 * 10 twips) with a 1/2 -inch (720-twips) gap between each line. Each line is 7 inches long (1440 * 7 twips). Next, I draw vertical lines starting at 1 inch (1440 twips) and stopping at 7 inches, with a 1-inch gap between lines. Each line is 10 inches long. This draws the grid where I can fill in information. Next, I compute a gap value for g that is used to center the text vertically within a cell. This value is based on one half of the difference between the height of one cell (720 twips) and the height of some sample text (Cell: G20). I divide it in half to get the distance between the top of the cell and the top of the text.
Next, I print the column headers and row headers in bold. I compute the actual header value and save it into t. This means that I can compute the TextWidth and print the value while only computing it once. The column headers are positioned down g twips from the top of the cell and centered in the cell.
The row headers are right-justified and also positioned down g twips from the top of the cell, but I leave a gap of g between the right edge of the cell and the left edge of the text. I did this simply because it looked a little better with the same distance between the top, left, and bottom edges of the text and the cell. I could have just as easily put the text right up against the right edge of the cell. Or I could have appended a couple of spaces between the edge of the text and the cell wall. You can use whatever method you feel comfortable with.
Then I generate some random numbers to print and print them using the same technique I used to position the row headers. Note that I turned bold off before I print the main text, since I want to emphasize the headers, not the text itself. Finally, I send the spool file to the printer with the EndDoc method. Figure 9.11 shows the results.
TIP: Go slowly and think about the entire page at one time: When building code to format a printed page, the trick is to go slowly and build the individual pieces, testing them one step at a time. Start with your header and footer. Make sure that they are showing up where you expect them. Next, add in the code to produce the first few lines of your output. Are the columns aligned properly? Are they justified correctly? (Sometimes, it is easier to do this with fake data rather than real data.) Once you are satisfied that everything looks good, add the rest of the lines and enjoy the finished product.

Figure 9.11: An example of a printed spreadsheet page