In this example, you will use the ActiveX Control Editor to create a simple web page containing a pie chart, and then you will view it in the Internet Explorer. After you have created the HTML page, you will edit it and create a bar chart.
Create a new folder named example1 in a convenient location on your computer.
Launch ActiveX Control Pad. A new HTML Source Editor window containing the following code will appear:
<HTML>
<HEAD>
<TITLE>New Page</TITLE>
</HEAD>
<BODY>

</BODY>
</HTML> Add a form to the web page by adding the following code between the <BODY></BODY> tags:
<FORM NAME="frmTest">

</FORM> Place your cursor between the <FORM></FORM> tags and insert a new ActiveX control by selecting Insert ActiveX Control from the Edit menu. When the Insert ActiveX Control dialog box appears, select the Chart object and click OK. The Edit ActiveX Control window and the Properties window should now be visible.
In the Properties window, change the Chart properties as follows:
| ChartType | 1 - Special Pie Chart |
| Height | 144 |
| ID | chtTest |
| Width | 186 |
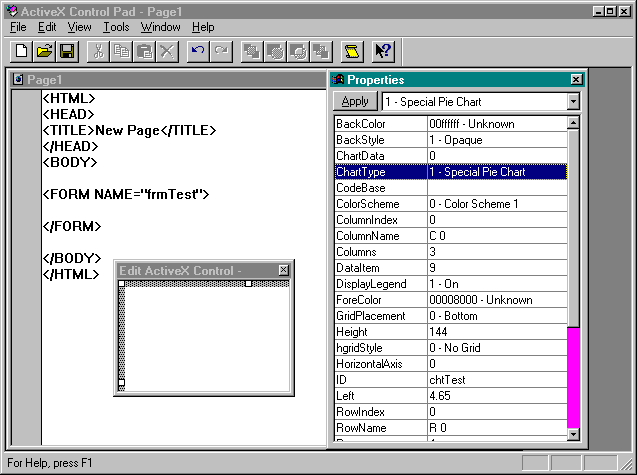
Figure 9-5 shows the Edit ActiveX Control and Properties windows after the Chart properties have been set.
Figure 9-5.
The Edit ActiveX Control and Properties windows for the pie chart.
Close the Edit ActiveX Control window to insert the Chart control code into your HTML document. The following code should appear between the <FORM></FORM> tags in your HTML code:
<OBJECT ID="chtTest" WIDTH=248 HEIGHT=192
    CLASSID="CLSID:FC25B780-75BE-11CF-8B01-444553540000">
    <PARAM NAME="_ExtentX" VALUE="6562">
    <PARAM NAME="_ExtentY" VALUE="5080">
    <PARAM NAME="Rows" VALUE="4">
    <PARAM NAME="Columns" VALUE="3">
    <PARAM NAME="ChartType" VALUE="1">
    <PARAM NAME="Data[0][0]" VALUE="9">
    <PARAM NAME="Data[0][1]" VALUE="10">
    <PARAM NAME="Data[0][2]" VALUE="11">
    <PARAM NAME="Data[1][0]" VALUE="7">
    <PARAM NAME="Data[1][1]" VALUE="11">
    <PARAM NAME="Data[1][2]" VALUE="12">
    <PARAM NAME="Data[2][0]" VALUE="6">
    <PARAM NAME="Data[2][1]" VALUE="12">
    <PARAM NAME="Data[2][2]" VALUE="13">
    <PARAM NAME="Data[3][0]" VALUE="11">
    <PARAM NAME="Data[3][1]" VALUE="13">
    <PARAM NAME="Data[3][2]" VALUE="14">
    <PARAM NAME="HorizontalAxis" VALUE="0">
    <PARAM NAME="VerticalAxis" VALUE="0">
    <PARAM NAME="hgridStyle" VALUE="0">
    <PARAM NAME="vgridStyle" VALUE="0">
    <PARAM NAME="ColorScheme" VALUE="0">
    <PARAM NAME="BackStyle" VALUE="1">
    <PARAM NAME="Scale" VALUE="100">
    <PARAM NAME="DisplayLegend" VALUE="0">
    <PARAM NAME="BackColor" VALUE="16777215">
    <PARAM NAME="ForeColor" VALUE="32768">
</OBJECT> Save the HTML document page as pie.htm in the example1 folder you created earlier. You will use it later, in Example #2. Open pie.htm in the Internet Explorer. You should see a web page that shows a pie chart. Figure 9-6 shows the pie chart in the Internet Explorer.
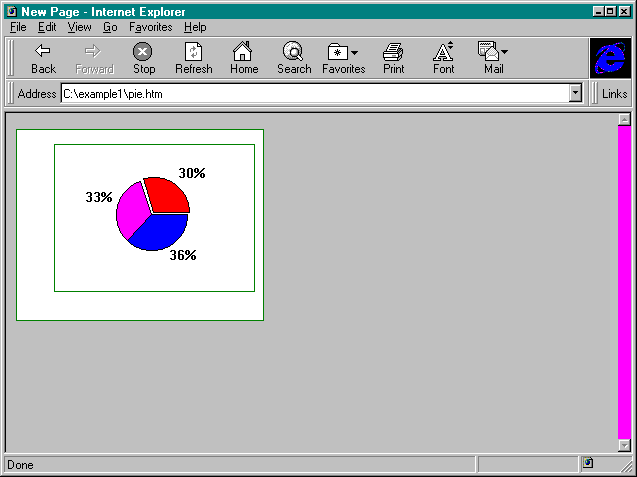
Figure 9-6.
A web page containing a Chart control inserted with ActiveX Control Pad.
Switch back to ActiveX Control Pad, and, in the HTML Source Editor, locate the control icon next to the <OBJECT> tag for the Chart control. Click once on the control icon to open the editing windows. In the Properties window, change the ChartType property to 14 - Simple Bar Chart. You should see the pie chart change immediately to a bar chart in the Edit ActiveX Control window. Close the Edit ActiveX Control window. From the File menu, select Save As, and save the HTML document as bar.htm in the example1 folder. Open bar.htm in the Internet Explorer to view the bar chart. Figure 9-7 shows the bar chart in the Internet Explorer.
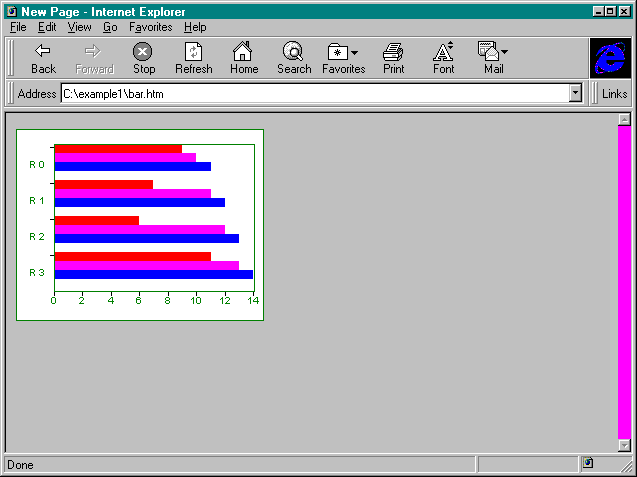
Figure 9-7.
A web page containing a Chart control edited with ActiveX Control Pad.