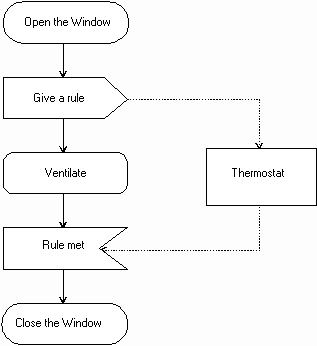
An activity diagram represents the execution state of a mechanism as a sequence of steps grouped sequentially as parallel control flow branches.
A statechart diagram may also represent this sequencing of steps. However, given the procedural nature of the implementation of the operations — in which most events simply correspond to the end of the preceding activity — it is not necessary to distinguish states, activities, and events systematically. It is therefore beneficial to have a simplified representation for directly displaying activities. In this context, an activity is displayed as a stereotype of a state. An activity is represented by a rounded rectangle, in the same way as states, but more oval in appearance.
The diagram below displays the graphical representations of activities and states, and highlights the simplification resulting from the direct representation of activities.


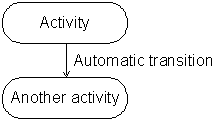
Each activity represents a particular state within the execution of the encompassing method. Activities are linked by automatic transitions, represented by arrows, in the same way as transitions within statechart diagrams. When an activity terminates, the transition is triggered and the next activity starts. Activities do not have internal transitions or transitions triggered by events.
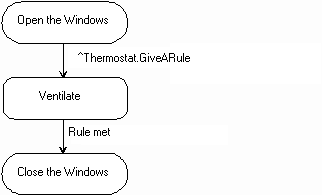
The following figure represents two activities linked by an automatic transition. It is not necessary to place an event name on the transition.
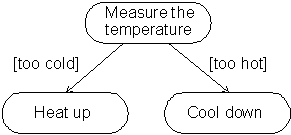
Transitions between activities may be guarded by mutually exclusive Boolean conditions. Guards are shown next to the transitions whose triggering they validate.
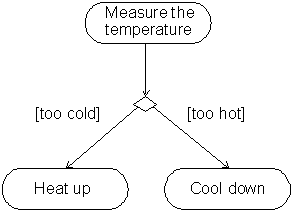
UML defines an optional stereotype for displaying decisions. A decision is represented by a diamond with many transitions coming out of it. The diagram below is equivalent to the last one, except for the fact that the decision is shown explicitly.
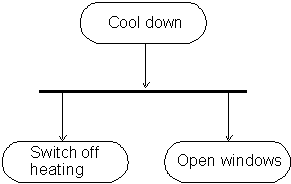
Activity diagrams show synchronizations between control flows by using synchronization bars. A synchronization bar makes it possible to open and close parallel branches within the flow of execution of a method or a use case. The transitions pertaining to the start of a synchronization bar are triggered simultaneously.
The following example shows that, in order to cool down a room, it is necessary simultaneously to switch off the heating and open the windows.
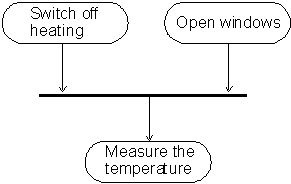
Conversely, a synchronization bar may only be crossed when all the input transitions on the bar have been triggered. The following figure extends the previous example and shows that the measurement of temperature is performed again once the heating has stopped and the room has been ventilated.
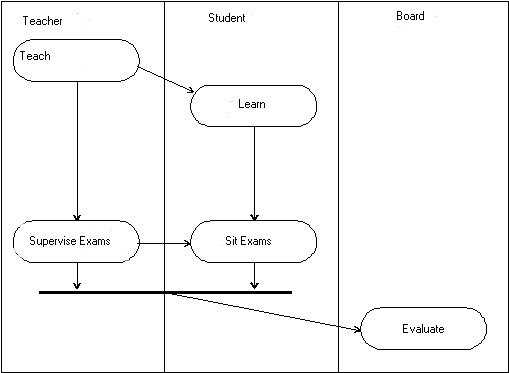
In order to show the various responsibilities within a mechanism or an organization, activity diagrams may be split into swimlanes (in much the same way as a swimming pool). Each responsibility is assumed by one or more objects, and each activity is allocated to a given lane. The relative position of the lanes is not important; transitions may freely cross lanes.
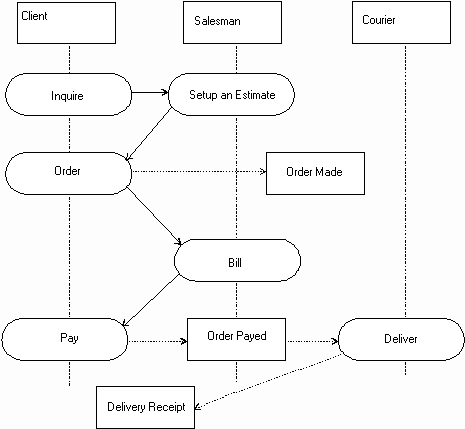
It is possible to show objects clearly within an activity diagram, either within swimlanes, or independently of them. Objects are represented by vertical lines, as in sequence diagrams, and activities appear, object by object, along their lifelines.
Often, several activities manipulate the same object, which changes state according to the progress of the mechanism. To increase readability, this object may appear in many places within the diagrams; its state is then specified with a bracketed expression at each occurrence.
Object flows are represented by dotted arrows. In this way, arrows relate an object to the activity that created it, and to the activities that involve it. When an object produced by an activity is used immediately by another activity, the object flow also represents the control flow. It is then unnecessary to represent this control flow explicitly.
The diagram below shows the various cases referred to in this discussion. In particular, the example shows an
object manipulated by various activities.Order
Activity diagrams may also contain states and events represented in the same way as in state transition diagrams. The following diagram gives an example of the simultaneous use of both notations:
UML also defines stereotypes for representing transition information explicitly. A signal broadcast is symbolized by a convex pentagon, linked by a dotted arrow to the object that is to receive the signal. Signal receipt is represented by a concave pentagon, linked by a dotted arrow to the object broadcasting the signal.
