The available selections for the graph type, set with the GraphType property, appear in Table 6.1.
Table 6.1 The graph control's GraphType property.
| GraphType | Type of Graph |
| 0 | None |
| 1 | 2-D pie |
| 2 | 3-D pie |
| 3 | (Default) 2-D bar |
| 4 | 3-D bar |
| 5 | Gantt |
| 6 | Line |
| 7 | Log/Lin |
| 8 | Area |
| 9 | Scatter |
| 10 | Polar |
| 11 | HLC |
We'll start with a simple line chart, GraphType = 6. Add this code to Page_Initialize:
Sub Page_Initialize
                Graph1.GraphData = 50
                Graph1.GraphData = 60
                Graph1.GraphData = 30
                Graph1.GraphData = 40
                Graph1.GraphData = 60
                Graph1.GraphData = 70
   -->          Graph1.GraphType = 6    'Change for diff graphs
                        .
                        .
                        .
        End Sub
In addition, let's label the graph. To use GraphTitle to add the title "Fish Consumption," we add this code:
Sub Page_Initialize
  -->           Graph1.GraphTitle = "Fish Consumption"
                Graph1.GraphData = 50
                Graph1.GraphData = 60
                Graph1.GraphData = 30
                Graph1.GraphData = 40
                Graph1.GraphData = 60
                Graph1.GraphData = 70
                Graph1.GraphType = 6    'Change for diff graphs
                        .
                        .
                        .
        End Sub
Let's also add more explanation at the bottom. We include a label reading "Measured in Tons" by placing that string in the BottomTitle property. (In addition to BottomTitle, LeftTitle is available for labeling the y axis.)
Sub Page_Initialize
Graph1.GraphTitle = "Fish Consumption"
--> Graph1.BottomTitle = "Measured in Tons"
Graph1.GraphData = 50
Graph1.GraphData = 60
Graph1.GraphData = 30
Graph1.GraphData = 40
Graph1.GraphData = 60
Graph1.GraphData = 70
Graph1.GraphType = 6 'Change for diff graphs
.
.
.
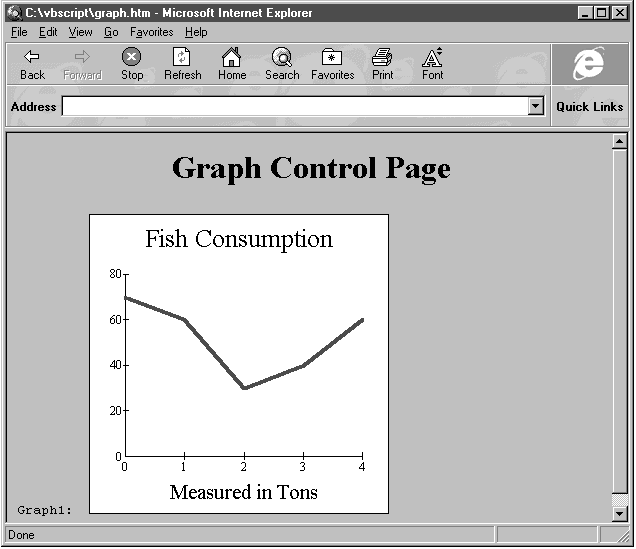
End SubNow examine the Web page in the Internet Explorer, producing the graph shown in Figure 6.6. As you can see, our data appears in the graph as a line graph, and our titles appear at the top and bottom of the graph. So far, then, the graph Web page is a success.
Figure 6.6 Our first graph displays its data as a line graph.
Let's try another type of graph: a 3-D pie chart. We change the GraphType property from 6 (line chart) to 2 (3-D pie chart):
Sub Page_Initialize
Graph1.GraphTitle = "Fish Consumption"
                Graph1.BottomTitle = "Measured in Tons"
                Graph1.GraphData = 50
                Graph1.GraphData = 60
                Graph1.GraphData = 30
                Graph1.GraphData = 40
                Graph1.GraphData = 60
                Graph1.GraphData = 70
   -->          Graph1.GraphType = 2    'Change for diff graphs
                        .
                        .
                        .
        End Sub
We can do more with pie charts. For example, we can "explode" one of the pie slices to draw attention to it—draw it slightly separated from the rest of the pie. Let's explode the first data point by setting its ExtraData property to 1. Each data point has an ExtraData property, which means different things for different GraphType settings; when we're drawing a 3-D pie chart, setting a point's ExtraData property to 1 explodes that pie piece.