To work with an individual data point, we use the ThisPoint property. This property selects the current point in the graph control; to select the first data point, we set Graph1.ThisPoint to 1:
Sub Page_Initialize
                Graph1.GraphTitle = "Fish Consumption"
                Graph1.BottomTitle = "Measured in Tons"
                Graph1.GraphData = 50
                Graph1.GraphData = 60
                Graph1.GraphData = 30
                Graph1.GraphData = 40
                Graph1.GraphData = 60
                Graph1.GraphData = 70
                Graph1.GraphType = 2    'Change for diff graphs
    -->         Graph1.ThisPoint = 1
                        .
                        .
                        .
        End Sub
Now that we've selected the data point to explode, we set its ExtraData property to 1:
Sub Page_Initialize
                Graph1.GraphTitle = "Fish Consumption"
                Graph1.BottomTitle = "Measured in Tons"
                Graph1.GraphData = 50
                Graph1.GraphData = 60
                Graph1.GraphData = 30
                Graph1.GraphData = 40
                Graph1.GraphData = 60
                Graph1.GraphData = 70
                Graph1.GraphType = 2    'Change for diff graphs
                Graph1.ThisPoint = 1
    -->         Graph1.ExtraData = 1
        End Sub
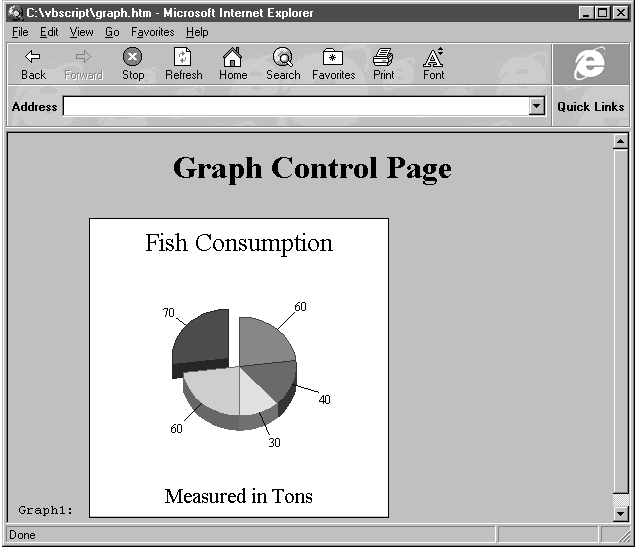
The new graph appears in Figure 6.7.

Figure 6.7 Our graph control displays our data as a 3-D pie chart with one exploded slice.
Of course, not all data will appear neatly at x positions 1, 2, 3, 4, and so on. Usually, we must set the x data just as we've set the y data. To set the x position of a point, we first select that point with the ThisPoint property and then set its XPosData property to the correct x value. Using this property (which cycles just as the GraphData property cycles), we can specify the x locations of our data points as well as the y values.
That's it for the graph control. As you can see, using it makes graphing numerical data very easy. The file graph.htm appears in Listing 6.3.
Listing 6.3 graph.htm
<HTML>
<HEAD>
<TITLE>Graph Control Page</TITLE>
</HEAD>
<BODY LANGUAGE = VBScript ONLOAD = "Page_Initialize">
<CENTER>
<H1>Graph Control Page</H1>
</CENTER>
<!- Graph>
<PRE>
Graph1:  <OBJECT CLASSID="clsid:0842d100-1e19-101b-9aaf-1a1626551e7c"
             HEIGHT=300 WIDTH=300 ID=Graph1></OBJECT>
</PRE>
<SCRIPT LANGUAGE = VBScript>
        Sub Page_Initialize
                Graph1.GraphTitle = "Fish Consumption"
                Graph1.BottomTitle = "Measured in Tons"
                Graph1.GraphData = 50
                Graph1.GraphData = 60
                Graph1.GraphData = 30
                Graph1.GraphData = 40
                Graph1.GraphData = 60
                Graph1.GraphData = 70
                Graph1.GraphType = 2    'Change for diff graphs
                Graph1.ThisPoint = 1
                Graph1.ExtraData = 1
        End Sub
</SCRIPT>
</BODY>
</HTML>
The graph control is useful and easy to use. The same is true for the next custom control we turn to: the multimedia control.