This article may contain URLs that were valid when originally published, but now link to sites or pages that no longer exist. To maintain the flow of the article, we've left these URLs in the text, but disabled the links.
January 2000


Last month (December 1999) I promised to show you how to get the exact state of a crash on a user's machine so you could debug it. I introduced WinDBG, the debugger that ships with the Platform SDK, and started to explain how to use it. This month I will finish the WinDBG discussion by showing you how to extend WinDBG with your own commands, called WinDBG extensions. I will also cover how to read crash dump files with WinDBG, and reveal a small utility I wrote—DbgChooser—that allows you to pick the debugger you would like to run when your own machine crashes.
Writing Your Own WinDBG Extensions
WinDBG extensions are actually fairly easy to write. The WdbgExts.h header file encapsulates everything you need. You will need to get the latest version of WdbgExts.h from the latest Platform SDK to work with the latest WinDBG. The version that ships with Visual C++® 6.0 will not work because it is the old WinDBG Extension format.
The WinDBG extensions concept is rather simple: extensions are simply DLLs with exported functions. Between the WdbgExts.h header file and the WinDBG extension I wrote for this column, you should understand how they work. There no longer seems to be any documentation from Microsoft on how to write them. However, Myk Willis wrote an excellent introduction to WinDBG extensions in the December 1998 issue of Windows Developer's Journal. In addition, Myk Willis's article includes a very useful sample WinDBG extension.
Figure 1 shows BugslayerExt.cpp, my sample WinDBG extension DLL. It supports four commands. The first is echo, a simple command that echoes the arguments to the Command window. You can use the echo command in conjunction with breakpoint commands. If you use the ? (Evaluate Expression) command in the breakpoint command list, WinDBG shows the results, but not the expression you are evaluating. If you have multiple expressions to evaluate, keeping them straight can be a hassle. In addition, the echo command is very simple, and you can step through it to see how WinDBG extensions work.
The remaining set of commands is a rudimentary timer system. There are times when it is nice to have an idea how long an operation took. The starttimer, elapsetimer, and stoptimer commands allow you to set up to four timers that will report the number of milliseconds between calls to those commands. Of course, the timers are not very accurate because they also include the overhead of WinDBG in their processing.
As you look through the code in Figure 1, you might notice that everything is set to use 64-bit compilation and versions of structures. This is because WinDBG is moving to the 64-bit interface for all WinDBG extensions. WinDBG will warn you that an interface is only the 32-bit interface, but it will still work.
One thing that really caught my eye when I looked over Myk Willis's article was that WinDBG extensions support a macro, GetExpression, that looks very much like the ? command. Armed with an expression evaluator, you could create some really cool extensions of your own. The first one that came to mind was an extension that walked memory allocated by the C runtime debug heap from CRTDBG.H and reported statistics about your allocations. Unfortunately, as I started using GetExpression, I found that it is even weaker than the ? command and will not return much that is useful. I hope that in a future version Microsoft will fix the expression evaluators so that you can use them from WinDBG extensions.
Crash Dumps
As I mentioned last month, a crash dump is the exact state of a program at the time of a crash as reported by Dr. Watson. You can create a crash dump by either checking Create Crash Dump File in the Dr. Watson user interface or by setting the REG_SZ value CreateCrashDump to 1 in the HKLM\Software\Microsoft\DrWatson registry key. The default location for crash dumps in Windows NT® 4.0 is %windir%\user.dmp. For Windows® 2000, the default location is \Documents and Settings\AllUsers\Documents\DrWatson\user.dmp.
Before you open the crash dump, it helps to have the right options set in WinDBG. WinDBG workspaces are a little weird and some of the options cannot be set to reasonable defaults. The two most important defaults can be set on the Symbols tab of the Windows Debugger Options dialog. They are "Load all symbols at startup" and "Prompt with a dialog box listing the symbol file and the error." You can either set these each time you start WinDBG, or you can change the following registry keys to ensure they are always set. In HKCU\Software\Microsoft\WinDBG\0021\Common Workspace\Options\User DLLs, edit the "Default load time" binary field, changing the first number to 01. This turns on "Load all symbols at startup." There does not seem to be any other way to set this option as the default other than by changing it in the registry. In HKCU\Software\
Microsoft\WinDBG\0021\Common Workspace\Options, "Browse For Syms on Sym Load Errors" must be set to 1.
If you find yourself having trouble with WinDBG workspaces, your best bet is to just delete the whole HKCU\Software\Microsoft\WinDBG key and start fresh. This has helped clear up some odd WinDBG problems for me in the past.
Once you have the crash dump, you need to open it with WinDBG. You can open it with either the Open Crash Dump command from the File menu, or the -z switch on the command line. However, opening the crash dump is only half the battle. The real issue is getting the symbols loaded. Sometimes it works and sometimes it doesn't. If you are dealing with a crash dump in Windows NT 4.0, the chance of getting the symbols loaded is slim because the crash dump file itself does not include the names of all the modules. At least you will be able to
debug at the assembler level. Windows 2000, on the
other hand, does a better job of matching up the module names when writing the crash dump, so you stand a good chance of getting the symbols loaded. Unfortunately, the Dr. Watson version from Windows 2000 will not run on Windows NT 4.0.
While researching this column, I discovered that the crash dumps created inside WinDBG with the .crash command have all the information needed to get a clean crash dump file. Since WinDBG is easy to download, you might consider having your customers get a copy of WinDBG and run your program inside the debugger. When the crash occurs, instruct your customer to use the .crash command to generate a good crash dump. While not as automatic as Dr. Watson under Windows 2000, it will get you a much more complete crash dump.
After you get the dump file loaded, start the debugger with the G command. Since you set the option to prompt you for symbol files earlier, you will get the dialog asking you to find the symbols for various modules. If the module name is a real one, you are in luck. If the module name is something like MOD01.DLL, you will not get symbols for that module no matter what you try. Unfortunately, this happens all the time in Dr. Watson crash dumps created under Windows NT 4.0.
After you have all the symbols loaded, you need to use the !reload command to get them reloaded; WinDBG does not seem to load them correctly the first time. On Windows 2000 and on WinDBG-created crash dumps on Windows NT 4.0, these steps always get me to the source code if the crash occurred in a module that had source code. Once you reload the symbols, you can use all of the normal views and wonderful debugging commands that WinDBG offers.
While I have been talking about crash dumps as something that you can use to debug crashes, you can also use them to debug multithreaded deadlocks. A neat utility called BREAKIN.EXE comes with WinDBG. It allows you to cause a breakpoint to trigger in a process. If your process is deadlocked on the user's computer, he can run BREAKIN.EXE, which causes an exception in your process and thus creates a crash dump file. If you are curious, BREAKIN.EXE uses CreateRemoteThread to start a thread in your process that just calls DebugBreak.
DbgChooser
When I am using GUI debuggers, I notice that something like 70 percent of the time I'm using the Visual C++ debugger and 30 percent of the time I'm using WinDBG. The big problem is when I get a crash when I am running outside the debugger. Depending on what I think the crash is, I want to run either WinDBG or the Visual C++ debugger. Sometimes I just want to generate a crash dump so I can look at the problem later. Since I wanted to choose my debugger at crash time, DbgChooser was born.
When a program running outside a debugger crashes, the operating system looks in the HKLM\Software\Microsoft\Windows NT\CurrentVersion\AeDebug registry key for the Debugger value. If the Debugger value exists, the operating system will spawn that program to debug the crash. The operating system passes the debugger the ID of the process to debug and an event ID to signal when the debugger finishes calling DebugActiveProcess. All I needed to do with DbgChooser was to write a program that the operating system called, which then passed the information straight on to the debugger the user wanted to use.
|
 |
|
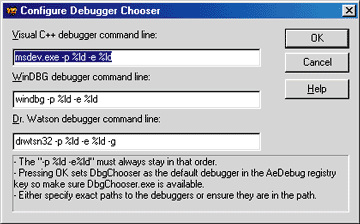
Figure 2 Configuring DbgChooser
|
Figure 2 shows the configuration dialog that you will see when running DbgChooser with no command-line parameters. I have all the defaults set for the three different debuggers. These defaults assume that the debuggers are all in your path environment variable. Once you have established the program locations for the debuggers, pressing the OK button will make DbgChooser set itself as the debugger that the operating system will call when you have a crash. DbgChooser puts its complete path in the AeDebug key, so you should put DbgChooser somewhere where it is the most accessible.
As you look at the command lines for the various debuggers, you might think that they look suspiciously like strings you would pass to sprintf. That is exactly what they are. If you look at the AeDebug key, you will also see that this is the format the operating system expects for the Debugger value. The operating system will load the debugger string and use it to build the string to pass to CreateProcess. I just do the same thing with DbgChooser.
|
 |
|
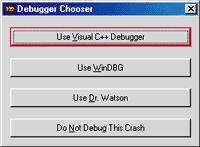
Figure 3 DbgChooser Options
|
Figure 3 shows the exciting DbgChooser dialog you'll see after your app crashes. Just pick your debugger and DbgChooser will start it up for you.
The implementation of DbgChooser is fairly mundane. There are only two issues of interest. First, since the operating system thinks DbgChooser is a debugger, the crashed process blocks on the event passed in the -e command-line switch. If the user decides not to debug the crashed application or closes the chooser dialog, he needs to signal that event or the crashed application will hang around forever. The value passed with the -e command-line switch is an actual handle value, so just call SetEvent on that value.
Second, when I first spawned a debugger out of DbgChooser, the debugger attached to the crashed process
but did not seem to work correctly. I was surprised because DbgChooser looked like a straightforward application
and I could not see what was getting in the way. I thought the problem might be that I needed to spawn the debugger and let it inherit my handles, which were actually the handles from the operating system. Debug loops require access to many things, and once I set the parameter to CreateProcess that allows handles to be inherited, everything worked as planned.
Wrap-up
With a little bit of luck, you should never have a case where you cannot duplicate a problem, because with crash dumps you can get the exact state. While WinDBG is a little different, the fact that it can read crash dump files and offers all of those killer informational commands means that you should seriously consider it for your debugging toolbox. DbgChooser is just icing on the cake!
Everyone gets to learn something new once in a while. Last month, I learned two new things. In the October 1999 Bugslayer column, I mentioned that you could not create MAP files out of Visual Basic®. Shaun Miller wrote to tell me that you can! What I failed to remember was that LINK.EXE can be controlled by the LINK environment variable. If you use the environment variable setting
|
in the environment where you start VB6.EXE, you can get a full MAP file. There's one caveat to setting LINK.EXE options through the environment variable: command-line switches override the environment variable settings. Turning on MAP file creation works just fine, but if you try to
set something that Visual Basic sets, then you will not be able to set it.
In the October 1999 Bugslayer column I also seemed to catch people's attention with the DebugCoGetThreadingModel function that returns the COM threading model for the current thread. I got a very nice e-mail from COM Jedi Zen Master Chris Sells, coauthor of the wonderful book ATL Internals. Chris's mail helped explain OXIDs and some other issues about determining the apartment ID. Chris also sent along a small code sample that demonstrates the techniques he referred to in his discussion. I included it with this month's code distribution, which can be found at the link at the top of this article. Chris's e-mail follows:
"A COM Apartment ID is called an OXID (which stands for Object eXporter ID—the old name for apartments was "object exporter"). An apartment's current OXID can be retrieved by marshaling an interface into a stream and looking at the right offset to find the OXID. A marshaled interface pointer has the following structure (as defined in the DCOM Protocol Specification):
|
 typedef struct tagOBJREF    {
     unsigned long signature; unsigned long flags;
     GUID          iid;
     union        {
         struct            {
             STDOBJREF       std;
             DUALSTRINGARRAY saResAddr;
         } u_standard;
         struct            {
             STDOBJREF       std;
             CLSID           clsid;
             DUALSTRINGARRAY saResAddr;
         } u_handler;
         struct            {
             CLSID           clsid;
             unsigned long   cbExtension;
             unsigned long   size;
             byte *pData;
         } u_custom;
     } u_objref;
 } OBJREF;
|
|
"In the case of standard marshaling, the u_objref will be a STDOBJREF:
|
 typedef struct tagSTDOBJREF {
   unsigned long  flags;      // SORF_ flags (see above)
   unsigned long  cPublicRefs;// count of references
                              // passed
   OXID           oxid; // oxid of server with this oid
   OID            oid;  // oid of object with this ipid
   IPID           ipid; // ipid of Interface
 } STDOBJREF;
|
|
The OXID itself is a 64-bit integer:
|
"Using this information, the OXID of the current apartment can be obtained by marshaling an interface on any object that does not perform custom marshaling and digging out the OXID. GetCurrentOXID, defined in oxid.h, does that.
"The current OXID is used by the Microsoft® proxy implementation as a debugging aid. As all COM objects must be called on the apartment on which they were created (with the notable exception of an apartment-neutral object), the proxy will check the creating OXID against the current OXID and return RPC_E_WRONG_THREAD if they're not the same. While there's no way to check an interface pointer to see which apartment it's supposed to be called from, there's no reason the object itself couldn't do the checking, just like the proxy, by using the GetCurrentOXID function to cache the OXID at creation time and check against the current OXID on every method call."
Chris, along with another COM Master Jason Whittington, also let me know about Dharma Shukla's wonderful Web page, http://members.tripod.com/IUnknwn, where Dharma has some wonderful COM debugging routines that you should definitely check out. Of course, I need to mention that the techniques on Dharma's page use undocumented fields and techniques that might break in future versions. Make sure to also hit Chris's Web site, http://www.sellsbrothers.com/tools, because he has some excellent tools and resources for COM developers.
Much thanks to Chris, Jason, and Shaun for setting me straight and to everyone else who wrote in. I really appreciate all the e-mail.
Da Tips
Start the millennium off right by sharing your debugging and development tips. Send tips to me at john@jprobbins.com.
Tip 29 Ziv Caspi sent an interesting idea on how you can get a reasonable name for the active thread when debugging Windows NT and Windows 2000-based applications. The debugger's Thread dialog only shows the thread ID. If you have multiple threads in your application, you can quickly get lost trying to figure out which thread is active in the debugger. The Thread Information Block (TIB), which Matt Pietrek covered way back in the May 1996 issue of MSJ, has a field—pvArbitrary (at offset 0x14)—that can be used by applications for any purpose. Since this field exists on a per-thread basis, Ziv's idea was to use it to store a string pointer.
I took Ziv's idea, wrote two functions (SetThreadName and GetThreadName) and included a sample project called ThreadName in this month's code listing. I encourage you to run the code in the debugger to see everything in action.
When it comes to naming threads, setting the thread name is just half the battle. The other half is viewing the thread name in the debugger. In the Watch window, set up the watch
|
|
For full Unicode builds, use the watch
|
"(unsigned char*)(DW(@TIB_Ox14))"
|
Then whenever you stop in a different thread, you will see its name and always know which thread you're looking at. Thanks for the great tip, Ziv!
Tip 30 I have received several hundred e-mails in the last couple of months from folks having trouble accessing their debug symbols with my CrashFinder (MSJ, April 1998) or my CrashHandler (MSJ, August 1998) application. When Windows 2000 ships, get IMAGEHLP.DLL, DBGHELP.DLL, and MSDBI.DLL and place them into the same directory as CrashFinder.EXE or your executables if you are using CrashHandler. That should get you going. I have been using all the Release Candidate versions of these three DLLs on Windows 98, Windows NT 4.0, and Windows 2000 without problems. Please keep in mind that these files are not redistributable, so you cannot ship them with your binaries. For more information about ensuring that your debug symbols are read properly, see the FAQ page at my Web site, http://www.jprobbins.com.

|
From the January 2000 issue of Microsoft Systems Journal.
|


