When you first started developing Microsoft ASP applications, you probably complained about— and also dreaded—the painful and time-consuming task of debugging complicated multi-paged sites. Working through this process was almost like stepping into a time machine, where coding in a text editor with little or no debugging support was considered state-of-the-art.
Until a few months ago, the only debugging tools available to developers were simple print statements that periodically tested the values of variables throughout the script. Fortunately, Microsoft felt your pain, and answered the developers' plea for debugging mercy with the introduction of the Microsoft Script Debugger.
Note: The Microsoft NT 4.0 Options pack installs IE 4.0, IIS 4.0, and the Microsoft Script Debugger. You can download the Options Pack from the Microsoft NT 4.0 web site.The Microsoft Script Debugger provides a comprehensive debugging environment that allows developers to test and correct run-time and syntactical errors in any ActiveX-compliant server or client-side scripting language (VB Script, Jscript). In this article, we'll demonstrate how to use the Microsoft Script Debugger to debug both client- and server-side script. We'll create a Visual InterDev project and add several ASP pages to it to demonstrate some different debugging scenarios.
In the first example, we'll create an .asp file that has a client-side syntax error and then debug the file. In the second example, we'll create and debug an .asp file that contains a runtime error.
You can use the Microsoft Script Debugger to test scripts written in Microsoft's VBScript and JScript, as well as applications written in Java that can be run in Microsoft's Java Virtual Machine (JVM). The Microsoft Script Debugger is very similar to the debugger found in the Microsoft Visual Basic product. Like the VB debugger, the Microsoft Script Debugger allows you to view the source code of the script you're debugging, control the speed of the script execution using the "Step Into, Over, Out, and Run" debugger commands, change the values of variables and properties using the debugger command window, and control the application process flow using the call stack to jump between scripting routines.
The debugger can debug both client-and server-side scripts. Client scripts consist of VBScript and JScript statements that Internet Explorer executes when the document is loaded, or in response to a user-generated event such as a button-click. The HTML page that contains the scripts is loaded into the browser. Then, as the browser parses the page, it reports any syntax errors it finds.
Server scripts consist of VBScript or JScript statements embedded in an .asp file. The .asp script is executed by IIS at the time the page is requested by the browser but before the content is sent to the browser. To debug a server-side script, you must run the Microsoft Script Debugger on the same machine that's running IIS 4.0. The script in an .asp file is processed from top down; therefore, both syntax and runtime errors are processed at the time the page is requested.
Setting up the debugger environment
Before we begin, there are a few things you should know and some steps you must complete to set up the script debugger development environment. First, remember that the script debugger can only debug server script from within a browser run on the same machine as the IIS 4.0 Web server. If you open a debuggable page that encounters a server error from a client machine, the client machine won't display an error or invoke the debugger. Instead, it will display an error message indicating that the browser can't open the page; the process will eventually time out.
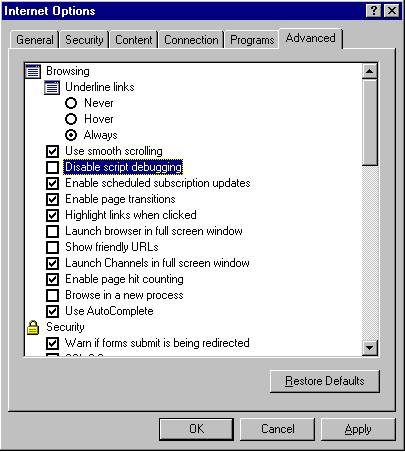
Next, if you're going to debug client-side script, you must first enable script debugging in IE4. To do so, first select the IE4 file menu's Internet options menu item. In the dialog that appears, select the Advanced tab and make sure that the Disable Script Debugging check box isn't checked, as shown in Figure A.

Figure A: Enable the Script Debugger in IE4 to debug your client-side script.
If you're debugging scripts on the server, you must explicitly enable debugging for each ASP application you wish to debug. For example, Figure B displays a picture of the Microsoft Management Console with the Internet Information Server snap-in already loaded. The highlighted directory, DebuggingASP, is a virtual application directory that contains the demo application we're going to debug.
To enable debugging, first select the virtual directory's Properties menu by right-clicking on the directory in the Explorer, as shown in Figure B. In the DebuggingASP dialog box that appears, select the Directory tab's Configuration button. In the Application Configuration dialog that appears, select the App Debugging tab and check both the server-and client-side debugging options, as shown in Figure C.
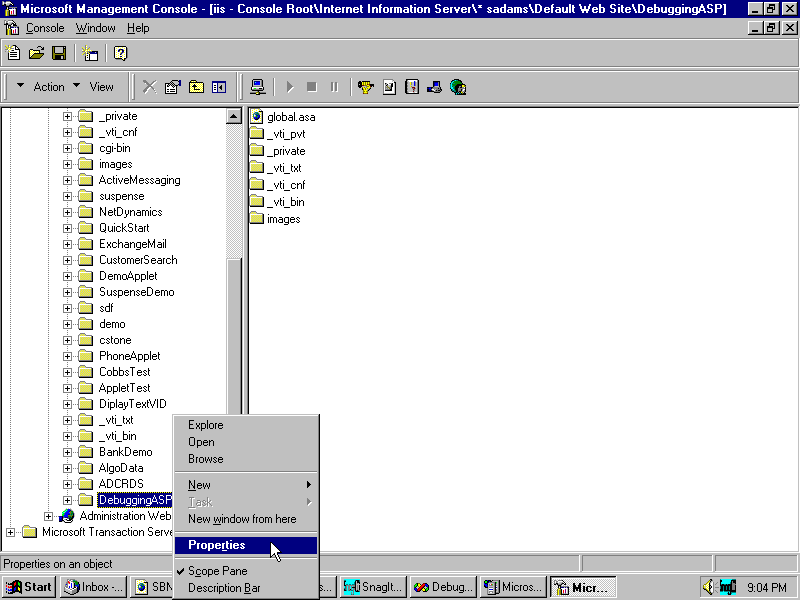
Figure B: To enable debugging, right-click the directory of the application you want to debug in the Microsoft Management Console, and click Properties;…
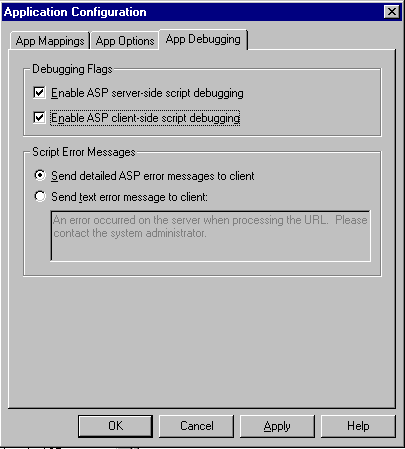
Figure C: …then, check the server-and client- side debugging options on the App Debugging tab.
There are four ways to invoke the Script Debugger: 1) manually, 2) from within an IE4 browser, 3) programmatically, and 4) in response to a scripting error. You can manually open the script debugger by selecting the Microsoft Script Debugger menu option from the program's main menu. If you installed the Windows NT 4.0 Solutions pack, it will be listed as a sub-menu item under the solution pack main menu.
You can open the Script Debugger from the IE4 browser by first browsing the page you wish to debug and then selecting the IE4 View menu's script debugger Open option. You can open the debugger programmatically with the "Stop" in VBScript or "debugger" in JScript commands. If you don't open the debugger manually or programmatically and debugging is enabled, the debugger will automatically open when the browser encounters a client- or server-side error.
When you open the Script Debugger, you'll notice three distinct windows listed under the View drop-down menu: Running Documents, Call Stack, and the Command windows. The Running Documents window lists each of the applications running on the current server. In Figure D, the Running Documents window displays a Visual InterDev project called DebuggingASP.
As Web pages are browsed, they're seen as individual line items in the Documents window. The developer can open and set break points in the code by selecting the file in the documents window and then setting breakpoints line by line (manual debugging).
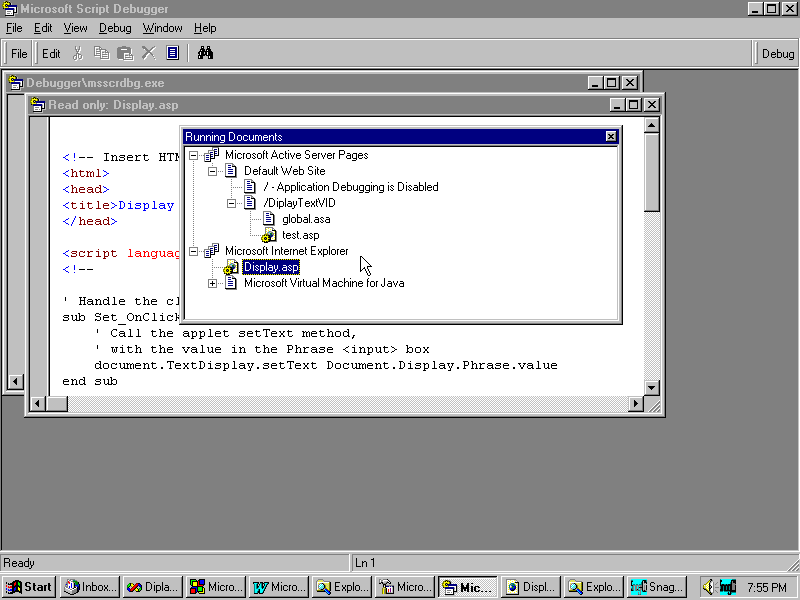
Figure D: The Running Documents window displays a list of applications currently running on the server.
The Call Stack window lists the procedures that were run during the current application's execution. The Command window allows the developer to query and modify runtime environment variable values.
There are two types of client-side scripting errors, those that occur in VBScript and those that occur in JScript. To demonstrate these errors, let's begin by opening the Visual InterDev development environment and creating a new Demo application Web site on your local IIS 4.0 server; call it DebuggingASP. Next, create a new ASP page in your Demo project, call it TestSyntax.asp, and insert into it the code displayed in Listing A. Your project in Visual InterDev should resemble the one displayed in Figure E.
Listing A. Contents of TestSyntax.asp
<%@ LANGUAGE="VBSCRIPT" %> <html><head><meta http-equiv="Content-Type"content="text/html; charset=iso-8859-1"><meta name="GENERATOR" content="Microsoft FrontPage 2.0"><title>Document Title</title></head><body><script language="VBscript"><!--Function TestIt()document.test.editboxx.value="Susie"End Function--></script><!-- Insert HTML here --><form name=Test><p>This is an Edit Box<input type="text" size="20" name=editbox><input type="button" name="B1"value="Button" language=vbscript onclick=testit()></p></form></body></html>
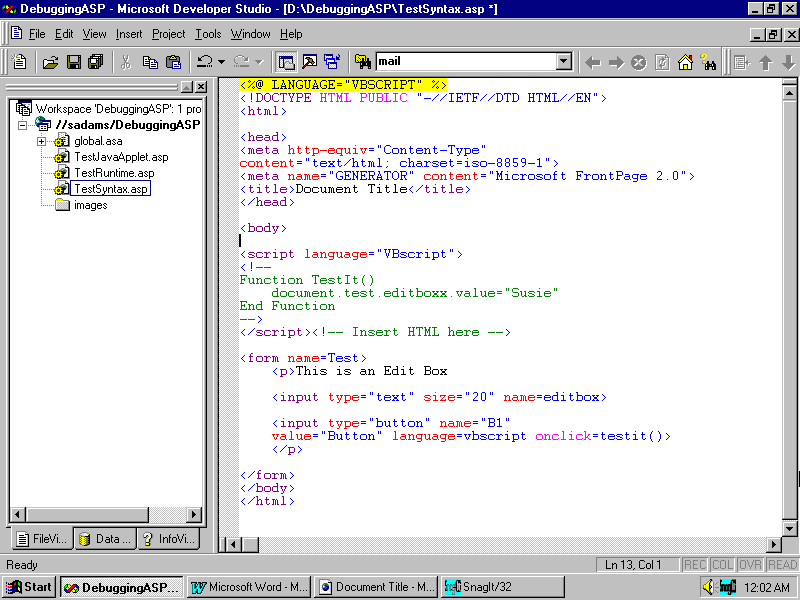
Figure E: Your Visual InterDev project should look like this.
This script creates a very simple asp page that contains one HTML text box and one push button. When the user presses the push button, the function TestIt() is called to display the text "SUSIE" in the text box.
To begin debugging this asp page, we need to first enable debugging in the Microsoft Management Console for the DebuggingASP application by following the steps we described earlier. Next, make sure that debugging is turned on in the IE4 client browser.
Now, change the reference in the TestIt() function to an invalid text box name, "EditBoxJunk".
<script language="VBscript"><!--Function TestIt()document.test.EditBoxJunk.value="Susie"End Function--></script>
Then, save and browse the page in IE4 by selecting the page in the Visual InterDev project explorer and right-clicking. In the menu that appears, select the Browse With Menu option, then select Microsoft Internet Explorer. The page should appear error free in the browser. Now, click the push button. An Internet Explorer Script Error dialog box will appear, as shown in Figure F.
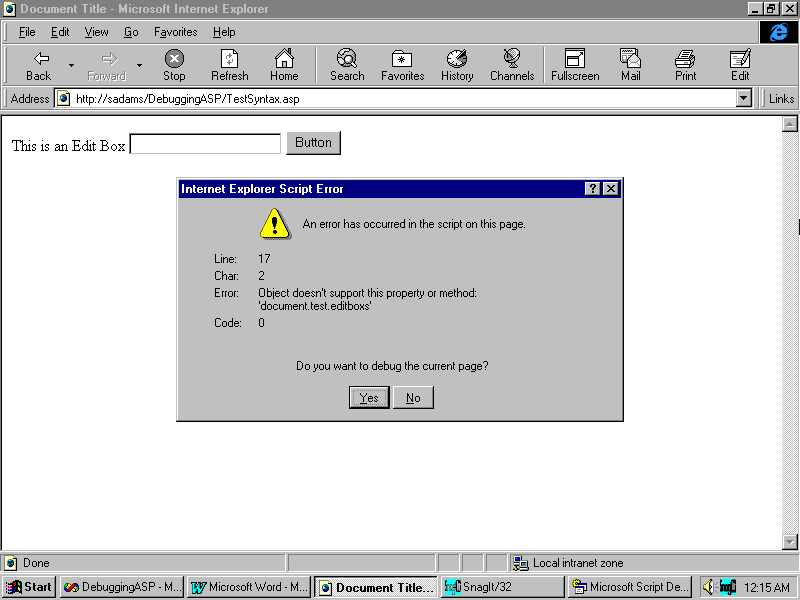
Figure F: The Internet Explorer Script Error dialog box appears to report a Client Side Syntax Error.
Next, select the "debug" button. The Script Debugger application should automatically open, with the cursor on the line of code that's in error, as shown in Figure G.
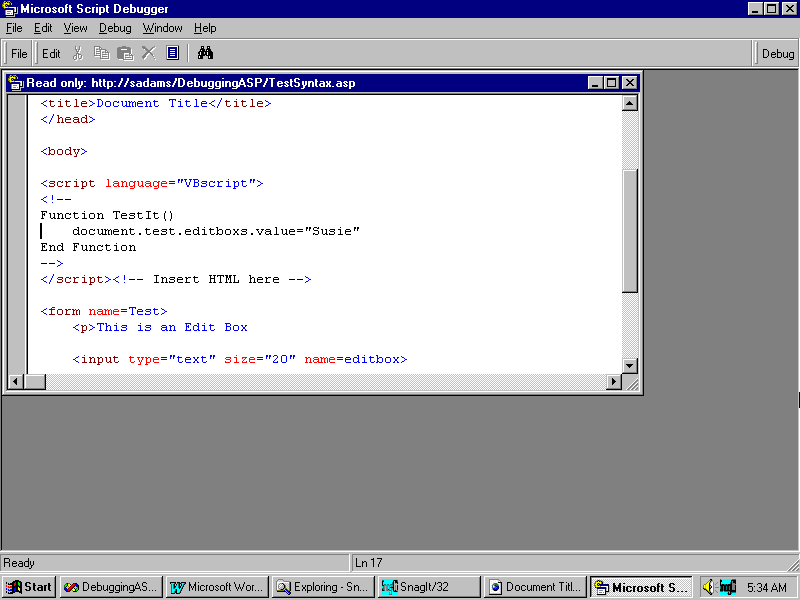
Figure G: When the Script Debugger opens, the cursor's location will reveal the erroneous line of code.
To correct the error, return to the Visual InterDev project, modify the script, and save the page. Then, browse the page in your IE4 browser once again, selecting the button on the test page. The text "SUSIE" now appears in the test box. (Remember to refresh the page if you don't close the browser.)
Note: If you're debugging client script generated by an .asp file, the line numbers reported in the error messages refer to the lines in the generated HTML document—not to the line numbers in the actual .asp file.Next, let's take a look at how the debugger handles server-side runtime errors. In the page we just created, let's change the language script identifier:
<%@ LANGUAGE="VBSCRIPT" %>to an invalid language
<%@ LANGUAGE="VBJUNK" %>Then, close the IE4 browser, save and re-browse the page. You'll notice something a little different this time, since the server-side error should have taken you directly to the script debugger. The cursor is positioned at the line in error; the error dialog box has disappeared. This functional difference is what helps you, the developer, determine the origination of an error. If the error is a server-side error and debugging is enabled, the debug window should appear; if the error is a client error, then the dialog will appear asking if you want to debug the script. If the debug options are off and a server-side error occurs, an error message will display directly on the rendered HTML page. Again, to correct an error found by using the Script Debugger, you must return to the Visual InterDev development environment. Here, you'll modify the script, then save and re-browse the page.
Note: If you set break-points in the script and then refresh a page, the script debugger will lose them.So far, we've investigated only syntax-related errors, but what do we do in the case of an error caused by a flaw in the programming logic? To begin, create a new page in the Visual InterDev project called TestRuntime.asp and add the following code:
<%@ LANGUAGE="VBSCRIPT" %>

<HTML>
<BODY>
<%
dim x, y
x = 1
y = 0

x = x/y
%>
This is a Test Application

<!-- Insert HTML here -->

</BODY>
</HTML>
After you've inserted this script, save it and browse the page. As the browser loads the page, you should notice the error shown in Figure H.
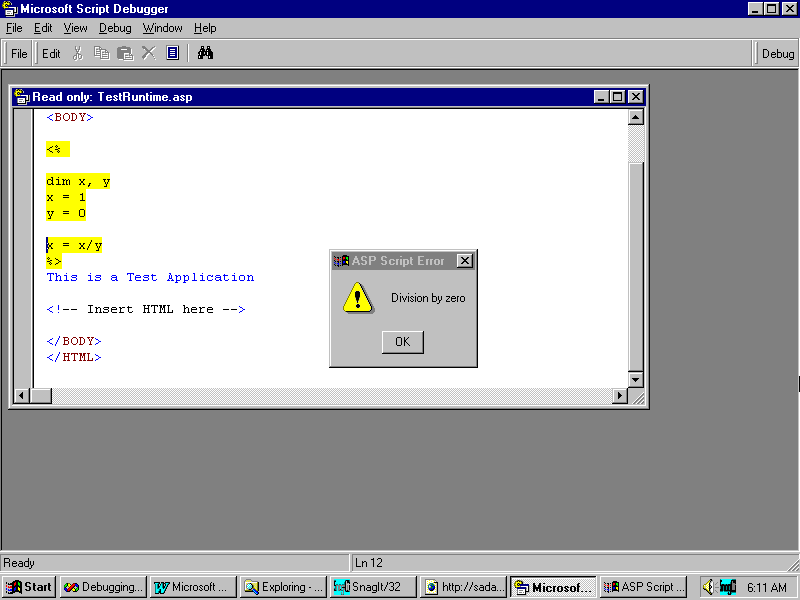
Figure H: Our sample code generates a Divide By Zero error.
After reviewing the error message, it appears as though the value of y in our equation is 0. But to make sure, let's determine the actual value of y by setting a break point and then walking through the script one line at a time.
To accomplish this, place a break point at the x=1 line of script by highlighting the line in the script debugger and pressing F9. You could also stop the execution of the code by placing a "stop" statement above the line of script on which you wish to stop execution. (Use lower case "debug" for Jscript.) Next, navigate back to the IE4 browser and refresh the page. The debugger should reappear with a red arrow next to the x=1 line indicating that the execution of the script has stopped at that line, as shown in Figure I.
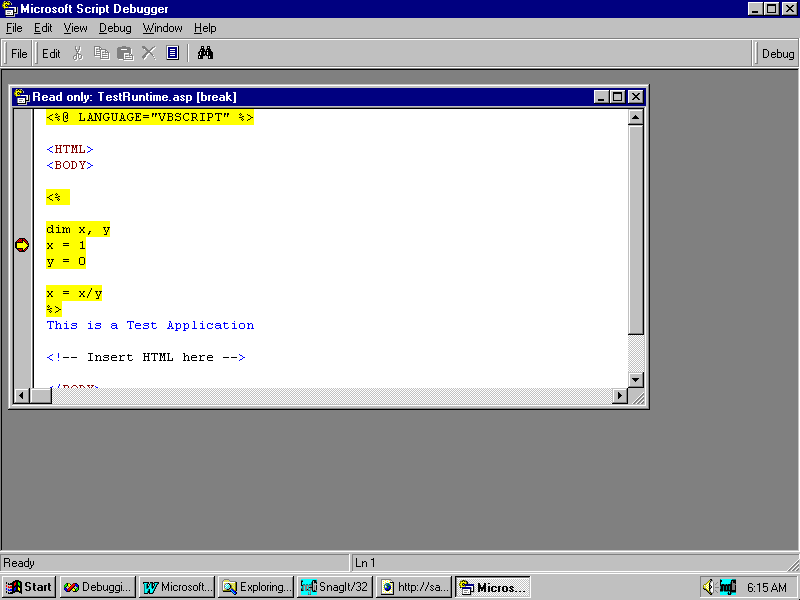
Figure I: Using break points, you can stop your script at pre-defined points.
Next, step through the script line by line until the arrow rests on the x=x/y line. You do so by pressing F8 for each line you need to navigate.
Now, lets determine the value of y by selecting the Command Window option from the Microsoft Script Debugger's View menu. The Command Window executes any line of code that's appropriate for current relative position in the script. For example: If you've stopped the execution of the script in the middle of a Jscript function, then the command window is expecting Jscript. In this particular case, we're in the middle of an ASP script, so the command window is expecting VBScript. In the command window that appears, type print y or ?y, as shown in Figure J.
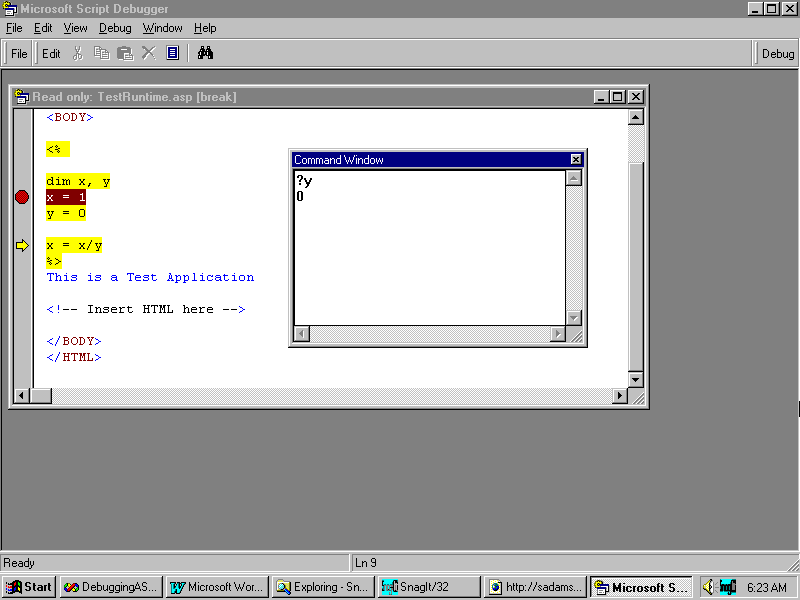
Figure J: You can issue commands in the command window to determine or change a variable's current value.
Sure enough, the value is 0. Next, let's change the value of y before the line of script executes by typing y=1 in the command window and pressing the Enter key. Then, enter the ?y command in the command window once again, and the value of y should now be 1.
To continue processing the script without having to step through each line of code, select F5. The page should display the text "This is a Test Application".
The functionality of a global.asa file is very different from that of an .asp or an HTML file. For starters, it's event-based and executes only once per application-user session. To debug the script contained in a global.asa file, you must programmatically halt its execution with either the "stop" or "debug" statement.
Once you find an error, you can correct it. However, whenever you want to retest the page in the browser, you must remember that there's currently no way to explicitly request the global.asa file from a client browser. The execution of the file occurs at the start of a user session. To start a new user session you must close and then reopen your client browser.
The addition of the Microsoft Script Debugger will almost certainly have a radical effect on ASP development time. We saw how you can step through VBScript and JScript and talked about how you can debug Java running in the Microsoft JVM. Now if we could only get the debugger fully integrated into the Visual InterDev and VB5 Developer Studio environment! For now anyway, Microsoft Script Debugger is definitely a giant step in the right direction!
Susie Adams is a senior consultant with Spectrum Technologies, a client/server and Internet solutions consulting firm in McLean, Virginia. She has more than 11 years of application development experience and currently focuses on the design and development of active content Web applications.
Copyright © 1998, ZD
Inc. All rights reserved. ZD Journals and the ZD Journals logo are trademarks of ZD
Inc. Reproduction in whole or in part in any form or medium without
express written permission of ZD Inc. is prohibited. All other product
names and logos are trademarks or registered trademarks of their
respective owners.