This article may contain URLs that were valid when originally published, but now link to sites or pages that no longer exist. To maintain the flow of the article, we've left these URLs in the text, but disabled the links.


April 1998

Microsoft Systems Journal Homepage

Download Apr98Bugslayer.exe (147KB)

John Robbins is a software engineer at NuMega Technologies Inc. who specializes in debuggers. He can be reached at john@jprobbins.com.

Here is the scenario: you are quietly plugging away at work, minding your own business, when the Vice President of ThankYouWellcome comes into your office screaming about how your application crashed. You calmly ask what he was doing when it crashed. At the top of his lungs, the VP bellows "Demoing it!" After giving the VP a very cool look you say, "That doesn't really give me a whole lot to go on." The VP then turns red and says that he wrote down some of the things that were on the screen and one of them said something about "address" and "crash." At this point the VP gives you the really big hairy eyeball and says "You're a programmer. You know what an address is. Fix it or else!"
      We've all been in that situation. Most of the time there is just not much you can do with a crash address—until now. In this month's column, I will explain how to easily find the exact function, source code file, and line where a crash occurred when given nothing more than the crash address. These techniques work for both Visual C++® and Visual Basic®-based code. First, I will give you some very simple bugslaying rules to follow during development that maximize your chances of always finding the crash location. These rules might be old hat to some, but I want to make sure that everyone—especially anyone who's new to Windows®-based development—is up on them. Second, I will present the appropriately named CrashFinder app that does all the work of finding a crash for you.

A Few Simple Bugslaying Rules
      The first simple rule is to always build both your debug and release binaries with full program database (PDB) debug symbols. While this might seem like common sense, the default Visual Basic and Visual C++ projects created with application wizards do not turn the debug symbol generation on for release build projects. Unless you are a total assembler programming guru, you are dead in the water without some form of debug symbols when trying to figure out where an application crashed. I have been amazed at how much time some good engineers will spend looking for particular problems in release build programs that could be found in a minute or two if they would simply turn on debug symbols.
      When you create an application wizard-based project, you need to immediately go to the project settings and turn on the debug symbol generation for all types of builds and subprojects. In Visual C++, you will need to tell both the compiler and linker to generate debugging information. If you have your own build system, always use /Zi switch with CL.EXE. For LINK.EXE, always use the /DEBUG and /PDB:<pdb filename> switches. If you are using Visual C++ to build your application, you can set all of your project's configurations at once with the following steps.

  1. Select the Project | Settings menu item to invoke the Project Settings dialog.
  2. Select the All Configurations option in the Settings For combobox.
  3. On the C/C++ tab, select Program Database in the Debug info combobox.
  4. On the Link tab, with the Category combobox on Debug, check the Debug info checkbox and the Microsoft format.
      For Visual Basic, select the Compile to Native Code radio button and the Create Symbolic Debug Info checkbox in the Compile tab of the Project Properties dialog.
      One misconception people have about creating debug symbols for an application is that they can only be created with a debug build. Fortunately, with Microsoft® compilers this is not the case; debug symbols can be created no matter how much optimization you are asking the compiler to perform. One difference between a debug build and a release build is that single-stepping through a release build with symbols can sometimes mean the source lines are not executed in order. This is because the optimizer reordered the code to make it faster. Another difference is that the call stack and some local symbols might not be available when running under a debugger because the code can be optimized so that the stack frame is not there. However, if you read Matt Pietrek's February 1998 column (Under the Hood), his crash course in assembler shows you how to figure out exactly what is happening.
      Another misconception is that building your application with debug symbols will make it possible for others to reverse engineer your application and steal all of your secrets. The PDB symbol format does not store any information in your binary other than the name of the PDB file. This adds 1KB to the size of your application. You can afford the minimal extra space to get the huge benefit of being able to debug your release builds.
      The second simple rule is to save in a safe place exact copies of the binaries that you send to testers or others. This includes copying all the associated PDB files. Again, this might seem like common sense, but I have seen too many cases where someone slipped in a "minor little change" before the source code was marked in the version control system. Therefore, there is no way to get the same build that has the crash in it. Saving all the binaries and PDB files maximizes your CrashFinder usage, as I will show you later.
      The third simple rule is to always rebase your DLLs and OCXs so that they load at unique addresses in your address space. If you ever see the following notification in the debugger output window, you need to stop and fix the load addresses of the conflicting DLLs immediately:

 LDR: Dll xxx base 10000000 relocated due to collision with yyy
       The xxx and yyy in this statement are the names of the DLLs that are conflicting. DLL load address conflicts are very bad because different machines and operating systems can load the DLL into different places. This means that if the relocated DLL crashes, you have no idea which DLL the crash occurred in since the operating system just reports the main executable that crashed, not the DLL. The other reason to make sure load addresses are unique is that when the operating system relocates a DLL, it can slow your application down. When relocating, the operating system needs to read all the relocation information for the DLL, run through each place in the code that accesses an offset into the code, and change it. If you have a couple of address conflicts in your app, it sometimes makes your startup more than twice as slow!
      There are two ways to set the load addresses for your application. The best method is to use the REBASE.EXE utility that comes with the Platform SDK. While REBASE.EXE has many different options, the best thing to do is to call it using the –b command-line option with the starting base address and put all of your DLLs on the command line. The MSDN documentation for REBASE.EXE suggests a rebasing scheme based on the alphabetical sorting of the DLL names. To keep life simple, I have always followed that scheme. You should run REBASE.EXE as part of your build process to ensure that it is always done.
      The other method of setting a load address is to specify it when you link each of your DLLs. In Visual C++, specify the address with the /BASE option to LINK.EXE. In the Visual Basic Project Properties Compile Tab, set the address in the DLL Base Address field. While it is preferable to use REBASE.EXE, you might need to set the address manually if you are working around third-party DLLs and OCXs. If you look at the Visual C++ project for BugslayerUtil.DLL, you'll see that I used this method to set the base address in an attempt to avoid conflicts if other applications eventually use it. The default base address for all DLLs is 0x10000000 and I did not want to conflict with that.
      The fourth simple rule is, yet again, along the common sense line: try to maximize the information your users or testers can give you about a crash. You can do this by writing crash handlers either in your application or by specifically asking the user for the Dr. Watson logs for your crash. Crash handlers are exception handlers. They trigger on crashes and dump the state of the application. I will be discussing these in a future column.
      Getting the Dr. Watson log can be a godsend. It will list all sorts of information about the state of the system and will even walk the stack to give you additional addresses that you can look up with CrashFinder. If you are sending out beta versions, you might want to remind your users to set up Dr. Watson and send you the logs for any crashes that occur with your application. An even better idea is to have your installation program check that Dr. Watson is already installed in the HKEY_LOCAL_MACHINE\SOFTWARE\ Microsoft\Windows NT\CurrentVersion\AeDebug key. Of course, you should only do this check during your beta cycle.

The IMAGEHLP.DLL Saga
      Before discussing CrashFinder's use, I need to mention a bit about how it works its magic. CrashFinder uses the IMAGEHLP.DLL symbol engine that first appeared in Windows NT® 4.0. When I was looking at the beta Windows NT 5.0 SDK, I noticed that there were new parts of IMAGEHLP.H that dealt with source and line information. This was exciting because it made the symbol engine moderately useful. Since the new functionality was only in Windows NT 5.0, I figured I would have to wait until it shipped before I could write CrashFinder. In the meantime, the November Platform SDK showed up on my doorstep and, lo and behold, the IMAGEHLP.DLL that shipped with it supported the new source and line handling! I have since figured out that there are four different versions of IMAGEHLP.DLL:

  • The original Windows NT 4.0 version
  • The November Platform SDK version
  • The WinDBG update version
  • The Windows NT 5.0 version
      The only one that does not support the new source and line information is the original Windows NT 4.0 version. CrashFinder does the right thing and checks which version of IMAGEHLP.DLL it loaded and reports if the source and line information is not available. All that is needed to make the IMAGEHLP.DLL symbol engine really useful now is local symbol lookup and a type evaluator. I certainly hope that Microsoft adds these capabilities, as it will open the door to some very interesting bugslaying tools.

Using CrashFinder
      My intent was to make CrashFinder usable across the development team, from individual developers, through test engineering, and on to the support engineers. If you follow the steps outlined above, it will be very easy for everyone to use CrashFinder. It is especially important to keep the binary images and their associated PDB files accessible, as CrashFinder does not store any information about your application other than the paths to the binary images. This is so you can create the CrashFinder project and continue to change your application as a whole without needing a CrashFinder project for each build. Now when your application crashes, your test or support engineers can fire up CrashFinder and add a vital piece of information to the bug report. As we all know, the more information that an engineer can get about the problem, the easier it will be to correct.
      You will probably need to have multiple CrashFinder projects for your application. In an ideal world, you will have at least two CrashFinder projects for the current build: one for each operating system that your application will be running on. It is also important to have a CrashFinder project for each version of your application that you sent to testers outside your immediate development team. This means that you will have to store separate binary images and PDBs for each version sent out—but disk space is extremely cheap when compared to saving you a week when fixing a bug.
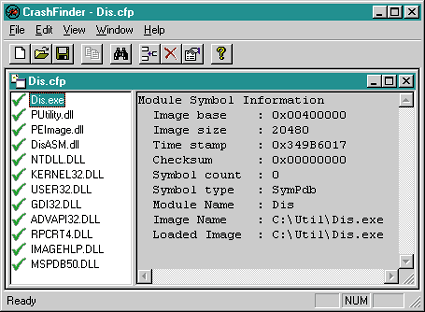
       Figure 1 shows the CrashFinder user interface with one of my personal projects loaded as a CrashFinder project. The left-hand portion of the child window is a tree control that shows the executable and any DLLs that the executable loads. The green check marks indicate that the symbols for each of the binary images have been loaded properly. If the symbols could not be loaded, then a red X indicates that there was a problem. The right-hand side of the child window is an edit control that lists the symbol information about the currently selected binary image in the tree.

Figure 1 CrashFinder UI

      Adding a binary image to a CrashFinder project is done through the Edit|Add Image menu command. When adding binary images, CrashFinder will only accept a single EXE for the project. For your applications comprised of multiple EXEs, create a separate CrashFinder project for each one. Since CrashFinder is an MDI application, you can easily open all the projects for each of your EXEs to locate the crash location. When adding DLLs and OCXs, CrashFinder checks that there are not load address conflicts with any other DLLs already in the project. If there are, CrashFinder will allow you to change the load address for the conflicting DLL just for the current instance of the CrashFinder project. This is very handy when you have a CrashFinder project for a debug build and you just built a single DLL without rebasing the whole debug build.
      As your application changes over time, you can remove binary images by selecting the Edit|Remove Image menu item. You can also change the load address for a binary image through the Edit|Image Properties menu at any time. Also, it's a good idea to add any system DLLs that your project uses so you can find places where you caused a crash in them as well.
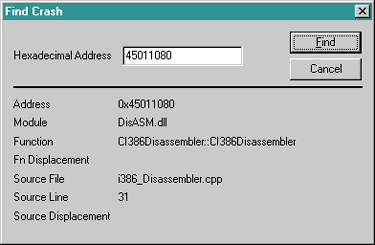
      The important part about CrashFinder is finding a crash address. Selecting the Edit|Find Crash menu option brings up the Find Crash dialog. Figure 2 shows an example of finding an address. All you need to do is type the hexadecimal address in the edit control and press the Find button for each address that you want to look up.
Figure 2 Finding a crash address

      The lower part of the dialog lists all the information about the last address looked up. Most of the fields in the lower part of the dialog should be obvious. The Fn Displacement field shows how many code bytes from the start of the function the address is. The Source Displacement field tells you how many code bytes the address is from the start of the closest line. Remember that many assembler instructions can make up a single line, especially if call functions are part of the parameter list.
      Keep in mind when using CrashFinder that you cannot look up an address that is not a valid instruction address. If you're programming in C++ and you blow out this pointer, you can cause a crash in an address like 0x00000001. Fortunately, those types of crashes are not as prevalent as the usual memory access violation crashes, which are easily found with CrashFinder.
      If your current application is perfect and you do not have any crashes to look up, I included a small sample application in the source code for this month's column that you can use to test out CrashFinder. This application, CrashOmatic, is a simple console executable with two DLLs that can crash in different places. The README file explains how to build it. Now that you know a little about using CrashFinder, I want to point out some of the implementation highlights.

Implementing CrashFinder
      CrashFinder itself is a straightforward MFC application, so most of it should be familiar. There are three key areas that I want to point out. The first is how I handled the different versions of IMAGEHLP.DLL, the second is where the work gets done in CrashFinder, and the last is the data architecture.
      For the IMAGEHLP.DLL symbol engine, I wanted to make sure that I had something that worked no matter which version the user had on their disk. Since I was writing a C++ application, I just encapsulated the whole thing into a class called CSymbolEngine (shown in Figure 3). As I promised in my last column, any reusable code becomes part of the ongoing BugslayerUtil.DLL. All the unit test cases are in the Tests directory under the main BugslayerUtil code directory distributed with this month's source code. While I could have had the CSymbolEngine member functions exported from BugslayerUtil.DLL, I set them up as inline members. This was because exporting C++ classes can be problematic and, in this case, it was not necessary as all the functions are mostly simple wrappers anyway.
      Much of the work needed for the CSymbolEngine class was trying to figure out at compile time which header version of IMAGEHLP.H was being used. Since some people might not have the new header, I wanted to make sure that SYMBOLENGINE.H compiled with everyone's code. I use the API_VERSION_NUMBER define to help figure out what should be included. The original SDK has a version number of five, while the updated version is seven. If you compile with the updated version header, I assume that you are also linking to the updated IMAGEHLP.LIB version as well, so CSymbolEngine just becomes a passthrough to the API calls. If you are compiling with the original SDK header, then CSymbolEngine will use GetProcAddress at runtime to determine if the IMAGEHLP.DLL in memory supports the new source and line functions. If you want to use CSymbolEngine without forcing the user to upgrade to the latest IMAGEHLP.DLL, you can define FLEXIBLE_SYMBOLENGINE. The CSymbolEngine class will then use the GetProcAddress method to determine if the source and line functions are present.
      I did come across one interesting bug when I developed the CSymbolEngine class. While all the debug builds ran just fine, the release builds would always crash when looking up an address. This stumped me, but when I disassembled CrashFinder, I saw that there was a call through one of the function pointers to one of the new source and line functions that was immediately followed by an ADD ESP,10h instruction. It took me a second to realize that you should only see the stack adjusted after a function call when the function is a cdecl call. Since the IMAGEHLP.DLL functions are all stdcall, I was declaring the functions incorrectly. The problem was in the typedefs for the function pointers; I had forgotten to include the __stdcall keyword.
      The second point about CrashFinder's implementation is that all the work is essentially in the document class, CCrashFinderDoc. It holds the CSymbolEngine class, does all the symbol lookup, and controls the view. The key function, CCrashFinderDoc::LoadAndShowImage, is shown in Figure 4. This function is where the binary image is validated and checked against the existing items in the project for load address conflicts, the symbols are loaded, and the image is inserted at the end of the tree. This function is called both when a binary image is added to the project and when opening the project. This way, the core logic for CrashFinder is always in one place and I could have CrashFinder store only the binary image names in the project instead of copies of the symbol table.
      My last point is about the data architecture. The main data structure is a simple array of CBinaryImage classes. The CBinaryImage class represents a single binary image added to the whole project and serves up any core information about a single binary—things like load address, binary properties, and name. When a binary image is added, the document adds the CBinaryImage to the main data array and puts the pointer value for it into the tree node extra data slot. When selecting an item in the tree view, the tree view will pass the node back to the document so that the document can get the CBinaryImage and look up its symbol engine information.

Exercises for the Reader
      Now that you've seen a little bit about how CrashFinder works, let's talk about how you can add some nice functionality. While CrashFinder is a pretty complete application as it stands, I can see some things that would make it much easier to use and more powerful. If you want to learn more about binary images, I would encourage you to add some of the following features. If someone really does add all of this functionality, I will be happy to post the updated CrashFinder so that everyone can benefit.
      First, automatically add dependent DLLs. CrashFinder now makes you add each binary image for the project by hand. It would be much nicer if CrashFinder prompted for the EXE and then automatically added all dependent DLLs when creating a new project. While this will not get them loaded dynamically, it saves a lot of individual adding.
      Second, show more information in the informational edit control. The CBinaryImage class has the functionality to show more information after the symbol information through the AdditionalInfo method. You could add the ability to show information from the binary image like header information, imported functions, and exported functions.
      Third, allow pasting in of DLL lists to automatically add them to the project. The debugger output windows list all the DLLs that are loaded by an application. You could extend CrashFinder to allow the user to paste in text and have CrashFinder scan through the text looking for DLL names.
      Finally, fix load address conflicts by rebasing the application. The ReBaseImage API from, where else, IMAGEHLP.DLL allows you to rebase an image yourself. This would make it much more convenient for users instead of forcing them to do it from an MS-DOS prompt.

Wrapup
      If you follow the simple bugslaying rules I presented and use CrashFinder, you should stand a fighting chance of figuring out where a crash in your application occurred. Now, when you get a crash address from a beta tester, you can be more productive by fixing the bug quicker. The best part is when the screaming VP is in the middle of his rant, you calmly whip out CrashFinder, load up your CrashFinder project, punch in the address, and before he takes another breath you can tell him that you know exactly where it crashed.

Da Tips!
      Did you hear? MSJ will pay a million dollars for each tip you submit to the Bugslayer column! April Fool's! Anyway, help your fellow developers by submitting a bugslaying tip to me at john@jprobbins.com.
Tip 7 Back in the October 1997 Bugslayer column, I wrote a library that helped you avoid memory leaks and other memory problems. Simon Bullen has a freeware library (with source code!) called Fortify that works with all ANSI C and C++ compilers. Fortify is far more complete than the code I presented. It has some excellent features for handling things like strdup, as well as a very nice scheme for checking for corrupted memory.
      One of the nicest features is the scope leak checking function. While seeing memory leaked at the end of the application is nice, you almost never know exactly where the leak occurred, only where it was allocated. Fortify has some macros that you can call at the start and end of scope and have it dump any memory leaked between the two. Fortify is worth looking at and can be found at http://www.geocities.com/SiliconValley/Horizon/8596/. Simon mentioned that he is hard at work on the next version and it should be posted by the time you read this. (Thanks to Simon Bullen, sbullen@cybergraphic.com.au.)
Tip 8 You know all those Windows structs that have cbSize as the first parameter? If I am going to be using them, I always write my own derived class that initializes the struct. For example:


 struct CMenuItemInfo : public MENUITEMINFO {
     CMenuItemInfo( )
     {
         memset ( this , 0 , sizeof ( MENUITEMINFO ) ) ;
         cbSize = sizeof ( MENUITEMINFO ) ;
     }
 } ;
      I have often spent 10 or 15 minutes tracking down a bug where it turned out I forgot to initialize one of these structs with the #!$% size! (Thanks to Paul DiLascia, askpd@pobox.com.)

Have a tricky issue dealing with bugs? Send your questions or bug slaying tips via email to John Robbins: john@jprobbins.com

From the April 1998 issue of Microsoft Systems Journal.