|
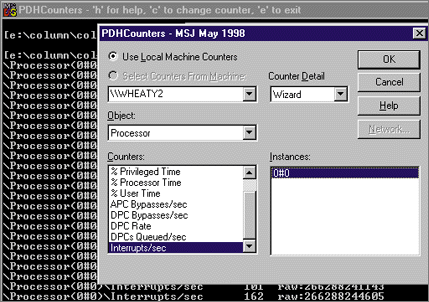
PDHCounters is very simple. The program lets you select a counter, and then displays that counter's current value once per second in a scrolling buffer. The output continues to scroll indefinitely or until you exit the program. You can only display one counter at a time, but the counter can be changed during execution. The program also lets you display the help (or "explain") text that Windows NT associates with each counter. All of the program's functionality is invoked by single keystrokes. The c key lets you change the counter, the h key displays the help text for the current counter, and the E key exits the program.
Looking under the hood, the first thing that PDHCounters does is obtain a query handle by calling PdhOpenQuery. Since the PDH APIs use the return value to indicate success or failure conditions, PdhOpenQuery returns the HQUERY by writing it to the buffer passed as the last parameter. To keep things simple, I made the HQUERY a global variable (g_hQuery) so that I didn't have to pass it around to the various functions.
After an HQUERY is established, the next step is to associate an HCOUNTER with the query. Obtaining a counter in turn depends on getting a path to describe the counter. Luckily, PDH.DLL has the PdhBrowseCounters API to bring up a dialog that lets you browse and select a particular counter. As you can see in my ChangeCounter function, there are many fields to initialize in the PDH_
BROWSE_DLG_CONFIG structure that's passed to PdhBrowseCounters.
The payoff for the complexity of calling PdhBrowseCounters is that the look and actions of the browse dialog can be very finely tailored. If you're looking for something simpler (but less flexible), you can use the PdhVbGetOneCounterPath API. Although the documentation says this API is for Visual Basic-based programs, it's certainly possible to call it from C++. You'll just need to supply the necessary prototype, since this API doesn't appear in
PDH.H. The dialog looks the same for both the C++ and Visual Basic APIs.
After selecting a counter path via the browse dialog, you create an HCOUNTER by passing the path to the PdhAddCounter API. PdhAddCounter takes an HQUERY and a counter path. An HCOUNTER buffer is filled in if everything was kosher. If you need some way to associate your own data with an HCOUNTER (for example, a pointer), you can pass the data to PdhAddCounter and retrieve it later via the PdhGetCounterInfo API. In 1, you can see where I use PdhAddCounter toward the end of the ChangeCounter function.
Since this program only displays one counter at a time, yet lets you change counters on the fly, the current counter needs a way to be removed from a query. The PdhRemoveCounter API does just that. Unfortunately, there seems to be a bug related to removing a counter using the Windows NT 4.0 version of PDH.DLL. After removing the old counter and adding a new one, PDH.DLL sometimes causes a fault in KERNEL32.DLL. However, swapping in the PDH.DLL from a Windows NT 5.0 beta seems to correct the problem. While I didn't track this down, the bug may be related to the use of PDH_BROWSE_DLG_CONFIG bIncludeInstanceIndex being set to TRUE. This confirmed bug was fixed in Windows NT 5.0.
So far, you've seen how to create queries, get counter paths, and add or remove counters from a query. Now let's turn to the fun part of retrieving and displaying counter values. Check out the while loop in function main of 1 . The call to PdhCollectQueryData updates any counters contained in the query. (In my case, there's only one counter, but you could certainly have multiple counters per query.) While on the surface PdhCollectQueryData is a simple API, a lot of work goes on under the hood to retrieve and parse the raw data returned by the Windows NT performance data system.
After retrieving a current counter value, my code next calls PdhGetFormattedCounterValue. This API also encapsulates much functionality. For instance, it can return the counter value as a 32-bit long (PDH_FMT_LONG), a 64-bit integer (PDH_FMT_LARGE), or as a double (PDH_FMT_DOUBLE). This API takes into account that many counters are time sensitive (for example, the number of context switches per second). If you were to look at the raw data for these counters, you'd see that they're simple values that just keep increasing. To properly interpret them, it's necessary to get the raw counter value twice,
then calculate the delta between the two values. That
delta can then be divided by the time difference to come up with a meaningful value. I'll show you an example to make this clearer.
Let's say you were interested in the number of context switches per second. The first time you got the counter's value, it might be 269680. Two seconds later, you retrieve the value again and it's 269956. The delta between the two values is 276. Dividing 276 by 2 yields a context switch rate of 138 context switches per second. The nice thing about PDH.DLL is that you don't have to save multiple counter values as well as when they were obtained to go through the previous steps. You can let the PdhGetFormattedCounterValue API hide all this from you.
Now, let's say that you wanted to get greasy. PDH.DLL also has the PdhGetRawCounterValue API, which fills in a structure with the data that PDH.DLL maintains for a given counter. This structure includes the time of the last counter update, as well as the current and prior raw counter values. By keeping the last two values and a timestamp, you can easily see how the PdhGetFormattedCounterValue API is able to work with time-sensitive counters. To see the difference between formatted and raw counter values, run PDHCounters.EXE, then select the Context Switches/sec counter under the System object. The first number shown after the counter path is the context switches per second, while the second number is the total number of context switches since the system started. The second number is obviously much larger.
At this point I've constructed queries and counters, retrieved counter data, and displayed it in formatted and raw form. The last major thing for the PDHCounters program to do is show the help (or explain) text associated with a given counter. If you've ever run PerfMon, in the Add To Chart dialog you've seen a button titled Explain>>. This is the text I'm after. PDH.DLL provides access to this string, as well as other information about a
given HCOUNTER, via the PdhGet-CounterInfo API.
Inside my ShowCounterHelp function, I create a PDH_ COUNTER_INFO structure with enough extra space at the end to contain the explain text. I then pass a pointer to this structure along with the HCOUNTER to PdhGetCoun-terInfo. Afterward, I show my cutting edge UI sensibility by using MessageBox to display the returned explain text.
Getting Fancy with PDH.DLL
What I've shown so far from PDH.DLL is great if you know what you're looking for. However, there's another set of APIs in PDH.DLL that will be of interest beyond just writing performance monitoring code. One of the top questions I receive is, "How do I enumerate a list of processes under Win32?" The same question could be applied to threads and modules as well. Until Windows NT 5.0 arrives with its support of the Toolhelp32 APIs, there is no cross- platform mechanism for enumerating processes, threads, modules, and so on. Until then, the Windows NT performance data is the primary way to get at this information under Windows NT. PDH.DLL has APIs to make collecting this information easier. A quick review of the performance data hierarchy is in order to make sense of these APIs.
There are objects starting at the top of the performance data. Performance data objects include the System, the Process, the Thread, the Redirector, and so on. Some objects have instances, while others do not. The Process, Thread, and Processor objects have instances-that is, there may be more than one process, thread, or processor. Other objects, such as the System and Memory objects, don't have instances. There's only one system, and all physical memory is considered a single unit.
Regardless of whether an object has instances, there are counters associated with it. If the object doesn't have instances, the counters are directly associated with the object. An example is the Available Bytes counter of the Memory object. If the object has instances, the object counters are associated with the instances. For example, there is an ID Process counter for each instance of a Process object. Put another way, each process instance has an ID, and the ID Process counter is how you might obtain that process ID.
The PdhEnumObjects API enumerates through all of the objects available from the performance data. The API fills in a buffer with a series of NULL-terminated strings that are concatenated together. Each string is the name of a particular object (for example, System, Processor, Memory, or Cache). The end of the list is indicated by a zero-length string. (Another way to think of the list end is two successive NULL characters.) The second parameter to PdhEnumObjects lets you specify a machine name to connect to. Passing zero means use the local machine. You can also request a detail level (novice, advanced, expert, or wizard). At the lower detail levels, certain objects won't show up because they're too geeky for a particular audience. Requesting the wizard detail means "Show me everything!"
Moving down to the level below objects, you come to PdhEnumObjectItems. For many programmers, this will be one of the most important of the PDH APIs. On input, you specify a particular object (for example, Process or Memory). The API returns a list of instances for that object if there are any and also a list of counters for the object (or its instances, as appropriate). Both the instance and counter list use the same multiple string format mentioned previously. That is, they're a series of contiguous NULL-terminated strings, ending with a zero-length string. If the object doesn't have instances, the instance list will contain just the double NULL bytes, indicating an empty list.
Having seen PdhEnumObjectItems, you can now surmise how something like a process list could be easily obtained. Simply call PdhEnumObjectItems, specifying Process as the object. The returned instance list will contain the strings Idle, System, smss, csrss, winlogon, and so on. If you need a detail such as the process ID, use the ID Process counter that each process instance has. PDH.DLL has the PdhMakeCounterPath API to make it easy to construct counter paths from discrete pieces of information assembled at runtime.
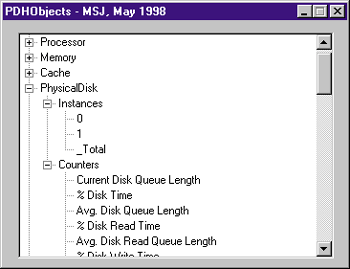
To show off PdhEnumObjects and PdhEnumObjectItems, I built the PDHObjects program (see Figures 3 and 4). Unlike the PDHCounters program, PDHObjects has a little snazzier UI. I used a treeview to show the hierarchy of objects, instances, and counters.
|
![]()


