In Development
By Brian Johnson
Microsoft Visual J++ 6.0 (VJ6) features a new IDE that it shares with Microsoft's other version 6 development products, including Visual InterDev, Visual C++, and Visual Basic. As long as we're all working with a new IDE, I thought it might be a good time to review basic debugging techniques to help get used to the new environment. In this article, I'll introduce debugging in VJ6. We'll be talking about setting breakpoints and stepping through code. For the true geek, this is the stuff that makes programming fun.
Learning to use a debugger can be difficult for those learning a new language, so it's often glossed over by instructors. I've found that learning a new language is easier if the debugger is mastered at the same time. The debugger is your window into what's happening inside a program. With this in mind, I'll keep the examples simple and concentrate on the basic debugging features of VJ6.
The Tools
There are a number of tools common to most debuggers. These tools provide current information about what's happening in your program the way the dials on your dashboard show what's happening as you're running your car. In addition to providing you with basic information — for example, the value of a particular variable in a running program — some tools let you change the value of variables or call functions to view their return values.
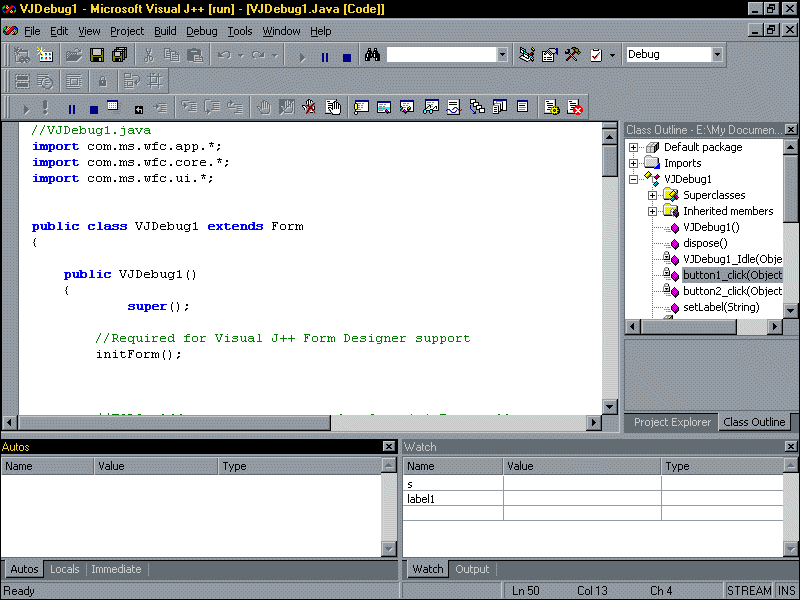
VJ6 provides you with a number of important view ports, where you can watch what's happening in your program. You can see the debugging windows in Figure 1. To view these windows, choose the appropriate name from the View | Debug Windows menu. There are five major windows where the action takes place:

Figure 1: Microsoft Visual J++ 6.0 in Debug mode.
In the Immediate window, you can type a simple expression to learn its value immediately (hence the name). This lets you play with the value of variables to quickly see how particular changes affect your program.
The Locals window gives you a glimpse of the value of local variables in a function. This window gives you a snapshot of the current values of these variables in the currently executing thread.
To see what's happening in all threads, take a look at the Autos window.
The Watch window lets you specify an expression to view during program execution. What differentiates the Watch window from the Locals or Autos window is the control you have over what you see. In the Locals window, you'll see a list of the variables currently in context. When one procedure is complete, the list changes. The expressions you specify in the Watch window stay put, making it easier for you to see what is happening with them as the code runs.
The Output window provides messages about the state of the running program. It also serves as a window where output messages are printed.
The Action
There are a number of ways to get a program running in Debug mode. The easiest is to simply click the Start icon on the Debug tool bar, or by pressing 5. When the program fires up, you'll see the standard debugging features of VJ6 go into effect. If there's a problem with your code, you'll see it pop up in the Task List, as shown in Figure 2. Depending on the severity of the problem, you're given the choice of continuing the run or stopping so that you can fix the problem. If you stop, double-clicking on the message takes you straight to the offending code.

Figure 2: The VJ6 Task List.
The VJ6 debugger gives you control over how your program runs. You can run the program one step at a time, or, more commonly, tell the debugger to stop only at specific statements, known as breakpoints. You can do this in a couple of ways. First, you can click in the gray area adjacent to the code window where you want the stop to occur. Keep in mind that this needs to be done only where program execution can be stopped, e.g. you can't set a breakpoint on a comment. You can also set a breakpoint by right-clicking in the Code window and then selecting a set breakpoint from the popup menu. You'll get a visual indication that the breakpoint is set along the left edge of the edit window, as shown in Figure 3.
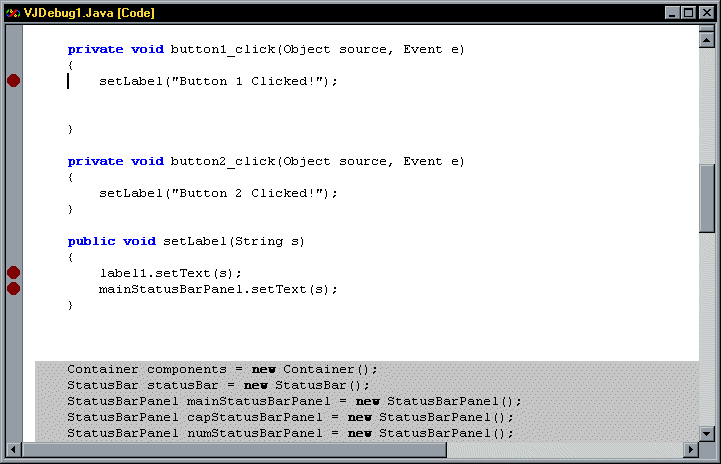
Figure 3: Breakpoints are indicated by red dots in the Code window.
Once a breakpoint is set, you can press 5 to start running the program in Debug mode. The program runs normally until it tries to execute the statement where the breakpoint is set. When the program reaches a breakpoint, execution stops. The Code window pops up and a little yellow arrow over the red stop dot indicates that this is where execution has stopped. At this point, you can use the Watch, Locals, or Autos windows to do things like check the status of the variables in your program.
Using the debugger, you have complete control over how your program runs. Usually, you will click the Continue icon on the Debug toolbar to continue running the program normally. The program will then stop at the next breakpoint if there is one.
You can also step through the code one line at a time by clicking on the Step Into icon on the Debug toolbar (or use the shortcut key, !). If the statement contains a method call, the program steps into the method and stops on the first statement. If you don't want to debug the method, you can skip over the method call and stop at the statement after the call by clicking on the Step Over icon on the Debug toolbar. (0). When single-stepping into methods, you might decide that you really wanted to step over the method. In that case, choose Step Out on the Debug toolbar, which runs the code in the called procedure and takes you back to the location from where the procedure was called.
Finally, to really control the way you step through your code, you can place your cursor in the Code window where you want execution to halt again, and click the Run to Cursor icon on the Debug toolbar (C0). This is just like setting a temporary breakpoint on a line. When execution reaches the breakpoint, the debugger stops and automatically removes the breakpoint.
An Example
Let's take a look at stepping through code in a trivial WFC program. I used the VJ6 Application Wizard to create a very simple form-based Java application (this application is available for download; see end of article for details). I added two buttons to the form, along with a label. I added a simple procedure that takes a string as a parameter. I did it this way to give us a little more to follow and to demonstrate what happens when you step over and step out of a procedure. You can see the code we'll walk though in Listing Five.
Begin Listing Five — VJDebug1.java
// VJDebug1.java
import com.ms.wfc.app.*;
import com.ms.wfc.core.*;
import com.ms.wfc.ui.*;

public class VJDebug1 extends Form {

  public VJDebug1() {

    super();

    // Required for Visual J++ Form Designer support.
    initForm();

    // TODO: Add any constructor code after initForm call.
    Application.addOnIdle(
      new EventHandler(this.VJDebug1_Idle));
  }

  public void dispose() {
    super.dispose();
    components.dispose();
  }

  private void VJDebug1_Idle(Object sender, Event e) {
    // Set the statusBarStates.
    StatusBarPanel sbPanel[] = statusBar.getPanels ();
    if ((GetKeyState(VK_CAPITAL) & 1) == 1)
      sbPanel[1].setText ("CAP");
    else
      sbPanel[1].setText ("");

    if ((GetKeyState(VK_NUMLOCK) & 1) == 1)
      sbPanel[2].setText ("NUM");
    else
      sbPanel[2].setText ("");
  }

  private void button1_click(Object source, Event e) {
    setLabel("Button 1 Clicked!");
  }

  private void button2_click(Object source, Event e) {
    setLabel("Button 2 Clicked!");
  }

  public void setLabel(String s) {
    label1.setText(s);
    mainStatusBarPanel.setText(s);
  }

  Container components = new Container();
  StatusBar statusBar = new StatusBar();
  StatusBarPanel mainStatusBarPanel = new StatusBarPanel();
  StatusBarPanel capStatusBarPanel = new StatusBarPanel();
  StatusBarPanel numStatusBarPanel = new StatusBarPanel();
  Button button1 = new Button();
  Button button2 = new Button();
  Label label1 = new Label();

  private void initForm() {

    this.setAnchor(ControlAnchor.ALL);
    this.setLocation(new Point(298, 88));
    this.setText("VJDebug1");
    this.setAutoScaleBaseSize(13);
    this.setClientSize(new Point(292, 193));

    mainStatusBarPanel.setAutoSize(
      StatusBarPanelAutoSize.SPRING);
    mainStatusBarPanel.setBorderStyle(
      StatusBarPanelBorderStyle.NONE);
    mainStatusBarPanel.setWidth(206);

    capStatusBarPanel.setAlignment(
      HorizontalAlignment.CENTER);
    capStatusBarPanel.setMinWidth(35);
    capStatusBarPanel.setWidth(35);

    numStatusBarPanel.setAlignment(
      HorizontalAlignment.CENTER);
    numStatusBarPanel.setMinWidth(35);
    numStatusBarPanel.setWidth(35);

    statusBar.setBackColor(Color.CONTROL);
    statusBar.setLocation(new Point(0, 173));
    statusBar.setSize(new Point(292, 20));
    statusBar.setTabIndex(0);
    statusBar.setText("");
    statusBar.setShowPanels(true);

    statusBar.setPanels(new StatusBarPanel[] {
      mainStatusBarPanel,
      capStatusBarPanel,
      numStatusBarPanel});

    button1.setLocation(new Point(24, 32));
    button1.setSize(new Point(96, 40));
    button1.setTabIndex(1);
    button1.setText("Button 1");
    button1.addOnClick(
      new EventHandler(this.button1_click));

    button2.setLocation(new Point(24, 96));
    button2.setSize(new Point(96, 40));
    button2.setTabIndex(2);
    button2.setText("Button 2");
    button2.addOnClick(
      new EventHandler(this.button2_click));

    label1.setLocation(new Point(160, 56));
    label1.setSize(new Point(120, 56));
    label1.setTabIndex(3);
    label1.setTabStop(false);
    label1.setText("");

    this.setNewControls(new Control[] {
      label1,
      button2,
      button1,
      statusBar});

  }

  public static void main(String args[]) {
    Application.run(new VJDebug1());
  }

  public static final int VK_CAPITAL = 0x14;
  public static final int VK_NUMLOCK = 0x90;

  /**
   * @dll.import("USER32",auto)
   */
  public static native short GetKeyState(int nVirtKey);

}
End Listing Five
Getting started. I've set three breakpoints in my code window. The first breakpoint is set at line 48 — the setLabel call in the button1_click procedure. The other two breakpoints are set in the setLabel procedure itself. When you press the Start icon on the Debug toolbar, or 5, VJ6 changes to Debug mode automatically, and the test application is run.
Notice at this point that execution of the program isn't halted, because the program has not yet executed any statement where you set a breakpoint. Clicking on Button 1 of the test application causes VJ6 to call the button1_click method, and the debugger stops execution on the breakpoint at line 48 of that method. You can see the state of VJ6 at this point in Figure 4.
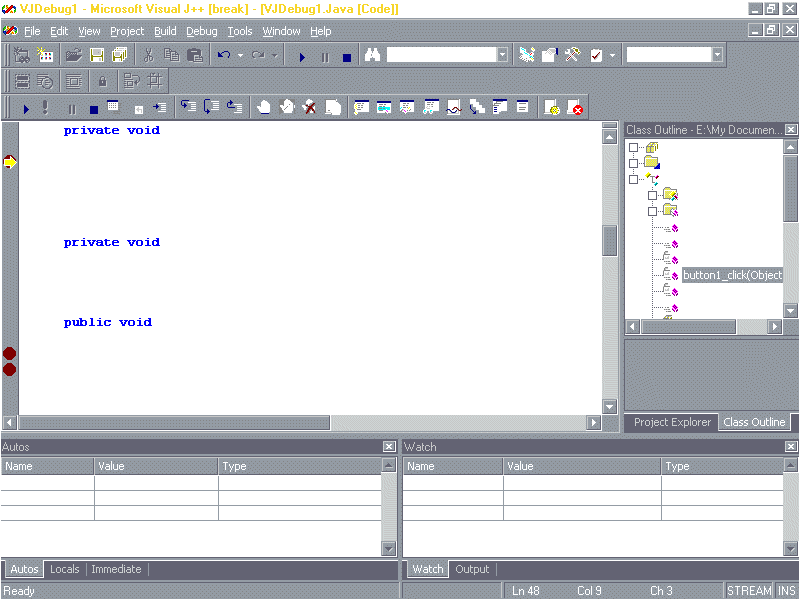
Figure 4: VJ6 after a breakpoint is hit.
Stepping in. Here's where stepping comes into play. As you click the Step Into icon, a single line of code is executed in the program. The yellow arrow in the Code window indicates the current line. After you click the Step Into icon after the first breakpoint, the arrow jumps into the called procedure.
Stepping out. If you're new to programming, a soft beam of light should be hitting you now, and you should hear music playing. You're able to watch the execution of your program the way that John Madden diagrams a football play — here's the ball, here's the ball being handed off. Using the Step Out icon, you can stop watching every line and jump directly to the next procedure. In this case, this returns us to the closing brace in the button1_click procedure.
The Locals window. In addition to just looking at where you're going, there's a lot more information to sift through as you step through the execution of code. While execution is stopped, check out the Locals window. Notice that the variables that are currently in scope are listed. As you step through lines of code, you can see the values of these variables change. You can also check out the properties of WFC controls along with the details of strings and variables in your program.
You can see the level of detail available to you in Figure 5, which shows the current state of the program as it is stopped during the setLabel procedure. As you can see, most objects do not have interesting values, but keep clicking those plus (+) signs to see successive levels of detail, including the size and position of controls, and so on.
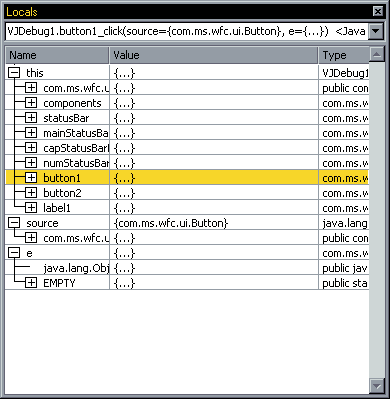
Figure 5: The Locals window provides information in detail.
Watchpoints. Because it can get tedious to sift through variables in the Locals window, you can set a watchpoint so that a particular variable is always available to you. To watch a variable, just select any variable in your source and right-click on it. Select Add Watch from the popup menu and you'll find the variable added to the Watch window. You can now watch the value of the variable as you step through the code. An advantage of the Watch window is that your watched variable is visible even when the variable is out of scope. When a variable goes out of scope, you'll see an error message letting you know that the symbol isn't found in the current scope.
The Immediate window. If you don't feel like setting up a watchpoint and you want to see the value of a variable quickly, simply type its name in the Immediate window. The value will be printed on the next line. This is nice if you run into one of those situations where you say, "huh?" and you want to know the value of x right away. You can see how this works in Figure 6.
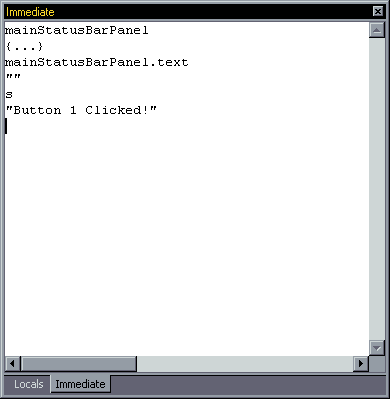
Figure 6: In the Immediate window, you can find the value of variables — well — immediately.
You'll notice that breakpoints only stop program execution when the program runs. That is to say, as you step through your code, other breakpoints you have set have no effect. These breaks only come into play as the particular lines of code are hit as the program executes in run mode. You can see this if you press Button 2 in the sample program. Execution stops where the breakpoint is hit in the setLabel procedure. You can freely set breakpoints throughout your code to make sure that everything gets tested. Just clear the breakpoint by clicking on it, as you've seen what you need to.
Breakpoint properties. Breakpoints can be more useful than they may first appear. VJ6 lets you set properties for breakpoints. The properties for a breakpoint are set through the Java Breakpoint Properties dialog box (see Figure 7). You can open this dialog box by right-clicking on a breakpoint and selecting Breakpoint Properties from the popup menu.
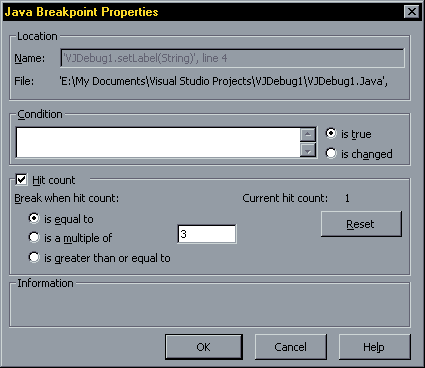
Figure 7: The Java Breakpoints Properties dialog box lets you set conditions for breakpoints.
Using the Java Breakpoint Properties dialog box, you can establish conditions under which the breakpoint is activated, so it will stop the program only under a particular circumstance. In the sample application, I set up a breakpoint in line 61 (the second line of the setLabel procedure) with the condition that program execution only be stopped the third time this point was passed during the execution of the program. To trigger the breakpoint, I clicked on Button 2, then on the Continue icon each time the first breakpoint was hit in that procedure. The new breakpoint doesn't cause a halt until the third time it's hit. This can be a very powerful tool, especially if you want to check the state of a program after a number of iterations through a loop.
If you want to see a list of all the breakpoints in your code, click on the Breakpoints icon on the Debug toolbar. This will bring up the window shown in Figure 8. The Breakpoints dialog box lets you enable and disable breakpoints, view the properties for your breakpoints, and jump to the code containing a particular breakpoint. It might not be necessary to track all your breakpoints this way in a small Java program, but for larger projects, it's easy to see how this could help you track your debugging chores.
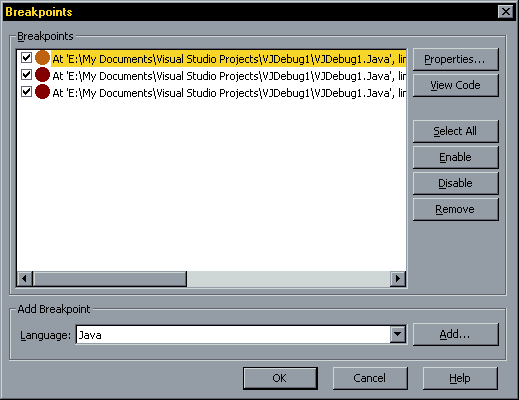
Figure 8: The Breakpoints dialog box lists the breakpoints set in your code.
The Call Stack window. There are two windows available to you that I haven't mentioned. The first is the Call Stack window, which lets you see the current active procedures in your application. You can access this window through the VJ6 View menu under Debug Windows.
The Threads window. The second window, also accessible through the View | Debug Windows menu item, is the Threads window. I haven't talked much about threads in this article because I wanted only to cover the basics. The Threads window lets you view the threads in your application and access the debugging information in those threads separately.
Conclusion
Debugging is one of the fun parts of programming. I know that's pretty geeky, but when you think about it, stepping through code and carefully observing execution gives you a view of a program as nothing else can. In fact, "debugging" clean code gives you a better understanding of what's happening inside a program and may even give you some ideas about how to improve the program.
After the latest Chicago Bulls NBA Championship, Michael Jordan mentioned how time slowed down for him in the closing seconds of the final game. He said that things became very clear to him and that he knew what had to be done to win the game. If you've never done so before, I suggest setting some breakpoints in interesting sample code and watching the program slowly execute. You'll be amazed at how clear your understanding of that code can become.
The files referenced in this article are available for download from the Informant Web site at http://www.informant.com/ji/jinewupl.htm. File name: JI9809BJ.ZIP.
Brian Johnson is a freelance writer in Orlando, FL. His most recent book is Microsoft Image Composer for Dummies [IDG Books Worldwide, 1998]. You can reach him at brianjay@gate.net or visit his home page at http://www.gate.net/~brianjay.