![]()
This article assumes you're familiar with Visual Basic.
|
This article may contain URLs that were valid when originally published, but now link to sites or pages that no longer exist. To maintain the flow of the article, we've left these URLs in the text, but disabled the links.
|
|
Using Compuware's NuMega DevPartner for Visual Basic
Ken Spencer and Charles Caison |
| Debugging troubles? Wish you could track down that pesky bug in your Visual Basic code, or just understand your project better? NuMega DevPartner can help you become a Visual Basic guru in no time. |
|
Compuware's NuMega DevPartner for
Visual Basic® consists of four products that work with Microsoft® Visual Basic to help
you build excellent applications. The products in the suite are CodeReview, SmartCheck, TrueTime,
and FailSafe. You would typically use each of these tools
in that order to obtain data that will help you produce
bulletproof applications.
CodeReview
|
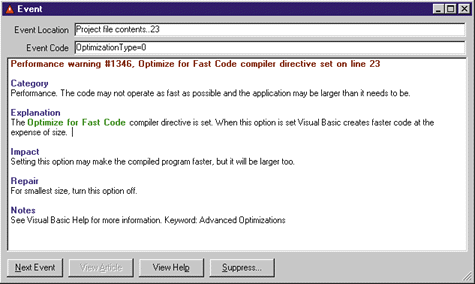
The Results window displays an overview of the events that CodeReview found, while the Code window displays the code that CodeReview used to generate the event. If you want to restart the review process without the wizard, choose Start from the Run menu. You can save review information to a disk file by choosing Save from the File menu.
You can adjust CodeReview's settings by selecting Options from the Tools menu. The settings on the General tab control the program environment. You can click the Review tab and adjust the settings to control how the review is run. When you select Default to Interactive Mode, CodeReview runs reviews, pausing on each event. If you deselect it, CodeReview runs the review in batch mode. The interactive mode is best for step-tracing through a project. In batch mode, CodeReview processes all files without pausing, which is useful for generating a to-do list. Enable Display Quality Metrics to display code line and other metrics about the review. If you select the "Make more responsive to user input, but slower" checkbox, CodeReview divides its time between executing the review and checking for user input. If you deselect this checkbox, CodeReview will not check for user input as often and will run faster.
You can decide which event classes to include in the review by using Report Types on the View menu. The Report Levels option on the View menu allows you to determine which notification types to include in the review. You can also choose which file types to include in the review using File Selections on the View menu.
CodeReview lets you enable or disable messages using
the Message Manager by selecting it from the Tools menu. Each item in the list represents a message that can be displayed in a review. To prevent a message from appearing in a review, double-click True in the Enabled column, which sets it to False.
CodeReview supplies a number of macros and special characters (no, not the same special characters that format message text) that help you define rules. Before you define rules on your own, look at the existing rules in the database to see how they are used there. You are better off creating a new rule than editing a rule that is provided with CodeReview, because if you mess up an existing rule, the only way to restore it is to reinstall CodeReview.
SmartCheck
SmartCheck is a runtime bug checker and automatic error correction tool. It analyzes fatal errors, tells you what went wrong, and suggests possible solutions. It displays and logs your events as they occur. The events include problems with:
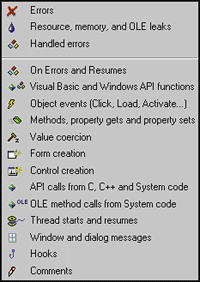 |
| Figure 2: Event Pane |
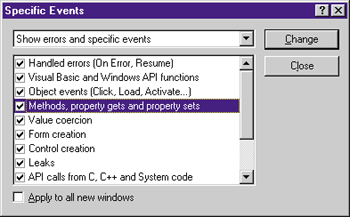 |
| Figure 4: Selecting Events |
|
By default, SmartCheck filters out events that you are not aware of when you write Visual Basic-based code. You can see under the hood of Visual Basic with the NuMega SmartCheck Settings dialog box. Select Program | Settings from the SmartCheck menu. Next, select the Error Detection tab, then click the Advanced button to display the Advanced Settings dialog box. Finally, deselect the "Suppress system API and OLE calls" checkbox. After you run your program, select Show All Events on the View menu to drill down into your Visual Basic calls. This will help you see the system interactions behind your Visual Basic-based code. When the program results window is displayed, use Specific Events on the View menu to show additional details such as API calls from C, C++, and system code, and OLE method calls.
You can make SmartCheck run faster with your program by using the checkboxes in the Performance Optimizations section on the Advanced Settings dialog box. Database programs run faster with "Suppress system API and OLE calls" selected. Programs that perform lots of background processing in timer loops benefit from "Cache program events." You can improve performance by enabling "Defer program results until program terminates" (but SmartCheck won't display the latest output). You can see your handled errors by selecting the Reporting tab on the Settings dialog box and enabling "Report handled Visual Basic runtime errors." You must also ensure that "Show errors and specific events" is selected on the Specific Events dialog box (under Specific Events on the View menu) and that "Handled errors (On Error, Resume)" is selected on the Specific Events dialog box. You may also want to ensure that SmartCheck only reports events in the files or modules that you choose by selecting the Files to Check tab on the Settings dialog box. Use the Component listbox to select the component that you want to check. Use the Associated Source Files listbox to select the files to check and to exclude. Don't exclude system components like comctl32.ocx, oleaut32.dll, ole32.dll and msvbvm50.dll, as these are required by SmartCheck. If you are debugging a regular Visual Basic-based application, your component will be the EXE file that is associated with your application. You can also check third-party ActiveX® components for errors and leaks. This includes the Visual Basic 5.0 runtime library DLL (msvbvm50.dll). Often, additional information about a bug in your program can be found by observing the invalid parameters and API failures that occur in msvbvm50.dll. To see these errors, select the Error Detection tab on the NuMega SmartCheck Settings dialog box, click Advanced, and select "Report errors even if no source code is available." The level of reporting and functionality is more limited in this case. SmartCheck cannot show errors occurring in modules that don't have debug information and it cannot pinpoint the line number on which the error occurs without the source code. If you do this, you'll likely see many OLE interface leaks at the end of your program. Some of these are from the OLE interfaces that represent Visual Basic controls, while others are from the OLE system DLLs.
TrueTime
To start using TrueTime with your application, you must use Visual Basic 5.0 to build your application and you must instrument it (NuMega vernacular for "tell TrueTime to add code for gauging the performance of your application") with TrueTime code. To instrument your application, start Visual Basic and open the project you want to instrument. On the Tools menu, select Run with TrueTime. TrueTime will then instrument and run your application. After you quit your application, TrueTime will display a session file that contains the performance information for that session. To save this session file as part of the active project, select Save on the File menu. You can use various session files to compare different performance scenarios. To start the application, select Run with TrueTime on the Tools menu. TrueTime will display a dialog with a progress bar to indicate how much of the application has been instrumented. After TrueTime finishes the instrumentation, it opens TrueTime and starts your application. You can use your application as you would normally while TrueTime silently watches and records what your application does. When you quit the application, TrueTime displays the main window and other windows. Figure 5 shows the TrueTime interface. The Project pane contains a tree view of the session files associated with the active NuMega project. The Output window contains a list of the events and errors TrueTime encountered while running your application. The Session window is located directly above the Output window and contains both the Filter and Session Data panes. The two panes display data about a session. The Filter pane contains a tree view of the source files and system images that your application used during the session. It also contains filters (at the bottom of the tree) that you can use to view a specific group of functions. A number next to each file name discloses the amount of time spent in that file as a percentage of the time spent in the whole session. The Session Data pane (not to be confused with the Session window) contains tabs that you can select to receive summary information. These include the Function List tab, Source tab, and Session Summary tab. When the Function List tab is selected, the Session Data pane displays the details of the item currently selected in the Filter pane. A great way to start analyzing your program's data is to find out which 20 functions in your application occupy the most time. Select the Function List tab in the Session Data pane and click the "% in Function" column heading to sort it in descending order. Click the Top 20 Source Functions filter near the bottom of the hierarchy in the Filter pane. The function names are listed with the file name and the function name separated by colons. The functions called the most are at the top of the list; those called the least are at the bottom. To filter the data further, click the icon that represents your application in the Filter pane, then click any of the files shown to display only the functions accessed from that file. As you do, notice that many of the same items appear as when you selected the Top 20 Source Functions filter. The ones that appear now are the only ones that are contained in the file that you selected. In the same way, you can see what functions were called on behalf of your application by opening the System icon. The icons displayed below System represent the components that were used by your application but aren't part of your Visual Basic-based project source files. When you click a component icon in the Filter pane, the procedures that are part of that component appear in the Function List in the Session pane. Several data columns are available for each function listing. You can click the Columns button on the Session toolbar to select the columns to display on the Function List tab. The Source tab displays the source code for the selected file with session data about each executed line of code in the source file. The Source tab shows the name of the file that is currently displayed. You can change the file displayed on the Source tab by double-clicking any of your project source files in the Filter view. |
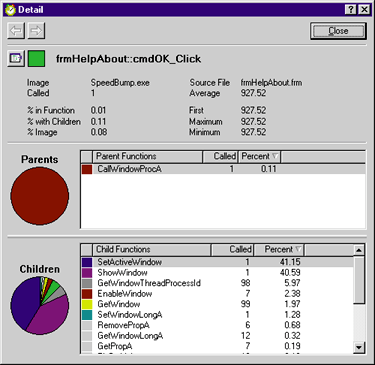 |
| Figure 6: Detail Dialog |
|
If you select a line in a function, you can display the Detail dialog by right-clicking and selecting Go to Detail, then selecting the function name from the context menu that appears. You can also display it by clicking the Details button on the Session toolbar. Figure 6 shows the Detail dialog. The lime green square represents the function cmdOK_Click in the pie charts. The text data in the topmost section is exactly the same as on the Function list tab.
The Parents section contains data about functions that called cmdOK_Click. You can see that the function CallWindowProcA called cmdOK_Click once. The percentage of time spent in cmdOK_Click relative to CallWindowProcA was 0.11 percent. In other words, of the total amount of time that it took CallWindowProcA and all of its children to process, 0.11 percent of that time was spent processing cmdOK_Click. The Children section contains data about the functions that were called by cmdOK_Click. You can see the names of the child functions, how many times each was called, and the time each child function used relative to the amount of time that cmdOK_Click and all of its child functions spent executing. Notice that cmdOK_Click is not on the list of child functions, but it is included on the pie chart as the lime green slice. You can move the mouse over the slice representing cmdOK_Click to determine the percent of time cmdOK_Click used relative to its child functions.
FailSafe
|
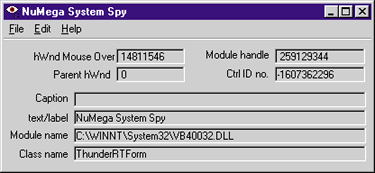 |
| Figure 7: System Spy |
|
To use FailSafe, instrument your application, compile your app with the newly added FailSafe tracing code, capture trace data from an instrumented project, then profile the trace. When you start FailSafe, the New Window dialog appears. Use this dialog to open a Trace window, a Profile window, or the AutoProcessor window. A Trace window displays information captured from instrumented programs. A Profile window displays profiles of information captured from instrumented programs. In the AutoProcessor window, you add and remove FailSafe instrumentation to or from a project file.
Start the process by clicking the AutoProcessor button. FailSafe displays a message box. Click Yes to tell FailSafe that you will be either adding or removing instrumentation. The AutoProcessor Wizard appears with the Step 1 tab selected. Click Next to move between each step. Use the Project button to select a Visual Basic-based project. In Step 2, choose whether to add or remove instrumentation and line numbers. Next, choose the files that you want to process and a template to use. Templates, which tell FailSafe how to process your project, are selected via a dropdown listbox. For example, if you are instrumenting beta and debugging builds of ActiveX components, you should use the LITE template. If you want full-featured debugging, use the MAXIMUM template. After you select a template, click Finish. FailSafe will give you the opportunity to back up your project and will tell you when it has completed instrumenting the project. |
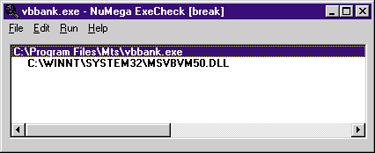 |
| Figure 8: ExeCheck |
|
Next, you need to configure FailSafe to capture data from the instrumented program. To start the Trace Wizard, select File | New to display the New Window dialog box. Click the Visual Tracer button. FailSafe will display a dialog box asking if you will be setting up a trace. Click Yes and the Visual Tracer Wizard will appear.
Now set up the trace window. To capture a new trace, leave the field blank and choose Next. Click Next again to skip adding Breakpoints or Filters or changing the display. These are advanced options and are safe to skip. Next, you should choose how the trace will be captured. No Delay will force your program to update the FailSafe Trace window before your program continues. Delayed writes trace data to a buffer and then lets your program continue. Minimize On Launch will minimize FailSafe when starting to capture trace information. This can help improve performance. Choose Next to move to the next step. Now choose a program to trace and whether to capture the trace output to disk. To trace an instrumented executable, choose Program to select it. To trace a project running under Visual Basic, leave this field blank. To have the trace written both to disk and to the trace window, choose Capture to specify an output file name. When you're finished, choose Next to move to the next step. Choose Finish to start capturing trace information with the selected options. After you let FailSafe collect trace information on your application, it is time to profile it. Select File | New to open the New Window dialog. Click the Visual Profiler button. If FailSafe asks if you would like help profiling a project, click Yes. The Visual Profiler Wizard will appear. Select the item that you want to profile from the Active Trace Window, select a trace file on the list, or click the File button to select a trace file to profile. For now, select Active Trace Window from the dropdown listbox, then click Next. Now, select the type of graph to be used and the column to sort data. For the graph type, select Area, 2-D. Select Module in the Sort Options dialog box. You can change these after the graph is generated. Choose the command for the FailSafe area you want to access. When prompted, choose either Yes to use the wizard for that window or No to open that window directly, then click Next. Click Finish to begin profiling the contents of the Active Trace Window. If FailSafe asks you to confirm that you want to profile the contents of the Active Trace Window, click Yes. The results of profiling are displayed in the Profile of Trace window. There are several types of data provided. The columns show information about your project (see Figure 9). A column at the top of the window is graphed at the bottom of the window. To chart a different column, simply double-click the column. To cross-reference the column with a module or a procedure, double-click the numeric data column first, then double-click the module or procedure column. For example, if you want to chart Hits by Module, double-click the Hits column to chart that data, then double-click the Module column. A chart showing Hits by Module will be displayed.
Conclusion
|
From the July 1998 issue of Microsoft Interactive Developer.