This article may contain URLs that were valid when originally published, but now link to sites or pages that no longer exist. To maintain the flow of the article, we've left these URLs in the text, but disabled the links.


August 1998

Microsoft Systems Journal Homepage

Custom Performance Monitoring for Your Windows NT Applications

Download Aug98Perf.exe (62KB)

Jeffrey Richter wrote Advanced Windows, Third Edition (Microsoft Press, 1997) and Windows 95: A Developer’s Guide (M+T Books, 1995). Jeff is a consultant and teaches Win32 programming courses (www.solsem.com. He can be reached atwww.JeffreyRichter.com.

Monitoring the health of a computer system is incredibly important. That's why Microsoft built performance monitoring into the very first version of Windows NT®. Unfortunately, Microsoft has not emphasized the importance of performance monitoring to the Outside world, so very few applications take advantage of it.
      Microsoft also didn't make it easy for an application to expose performance data information. I looked into adding performance information to my own applications about two years ago. I remember being flabbergasted to see how complex it was and deciding to postpone adding this feature. Around last September, I vowed to bite the bullet and go for it. I decided to create a C++ class that encapsulates the process of exposing performance data to the Operating system. This would allow me to easily add performance data to any application.
      Before I present my C++ class, I want to explain the basic performance-monitoring facilities that Windows NT offers. You can examine performance monitoring from several different perspectives, and I'd like to touch on all of the M.
      I'll begin by examining performance monitoring from a user's perspective. I'll explain how the system organizes performance information and how administrators, users, and developers can use the PerfMon tool to see how healthy a computer system is. I will then discuss some of the more common reasons for using performance monitoring when designing an application or Windows NT service. I will then get more technical and discuss the Windows NT performance monitoring architecture from a systems and programmer's perspective.

Performance Monitoring: A User's Perspective
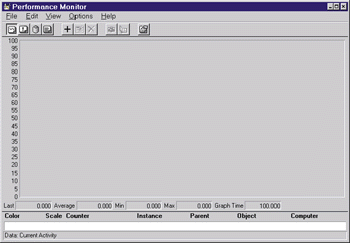
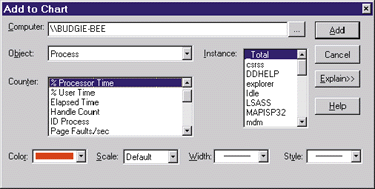
      Both Windows NT Workstation and Windows NT Server ship with an administration tool called PerfMon.exe. Every day, I'm amazed at how many people I run into who are unfamiliar with this tool. When you run PerfMon, it displays the dialog shown in Figure 1. Initially, PerfMon has no idea what performance information you would like to monitor, so its chart is empty. To add information to the chart you must display the Add to Chart dialog shown in Figure 2. I'm going to explain the meaning of all the fields in this dialog so that you will see how all of this information fits together when I discuss the developer's role in producing performance counters later on.

Figure 1 The Windows NT Performance Monitor


      The first field, Computer, allows the user to indicate the computer from which performance information should be collected. You can use the ... button to choose a computer from a listbox. Once you have chosen a computer, you then move to the Object field. A component in the system that wants to offer performance information does so by exposing objects. Out of the box, Windows NT exposes many objects, most of which are system-related. The system objects include Processor (the CPU itself), Process (the applications that are currently running), PhysicalDisk (your hard disks), System (the Operating system itself), Thread (the threads running in processes), and Memory (RAM).
      Performance monitoring is not limited to operating system components. Device drivers are also able to expose their own performance counters. Some examples of device driver counters include Telephony (TAPI), Remote Access Server (RAS), and TCP/IP. All the Se counters are useful to the people who configure Windows NT. The system also allows services and applications to expose their own performance counters.
      The designer of a performance object also defines what counters that object supports. For example, in Figure 2 you see that the Process object offers several counters (visible in that Counter listbox). Each entry in the listbox indicates one thing you can monitor about a process. For example, monitoring % Processor Time will show you the percentage of time that threads within a process are actually running on a processor. The Handle Count counter shows how many objects a process has open by reporting a count of handles in the process handle table. The ID Process counter shows the 32-bit system-unique ID that was assigned to a process when it was created. The Page Faults/sec counter shows the rate at which pages in disk storage are being loaded into RAM for this process. the Se are just a few of the counters available for a Process object.

Figure 2 Add to Chart


      The next important field in the Add to Chart dialog box is the Instance listbox. Instances can be confusing at first because some objects do not support instances at all. An excellent example of this is the System object. After all, there is only one Windows NT-based system running on the computer system. Most objects, however, do support instances. For example, there is one instance of a Process object for every process currently running. The Processor object also supports instances, but since most people run Windows NT on a uniprocessor machine, the Instance listbox shows one entry: 0. If you run Windows NT on a machine with two processors, there would be two instances in the Instance listbox: 0 and 1.
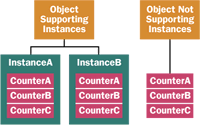
      Figure 3 shows the relationship between objects, instances, and counters. On the left is an object that supports instances. This object may currently have zero or more instances associated with it. Each of the Se instances has the same number of counters, but the values of the counters will differ from instance to instance. Keep in mind that if an object that supports instances currently has no instances associated with it, no counter information can be obtained.

Figure 3  Objects, Instances, and Counters


      On the right in Figure 3 is an object that does not support instances. This object will always have one set of counters associated with it. When first working with performance counters, many people find this difference to be confusing, but you get used to it after a while.
      Notice that the Objects and counters in the Add to Chart dialog have cryptic names. To make it easier to understand, Microsoft added the Explain button to the dialog box. When you select the Explain button, the dialog box expands and a new Counter Definition area appears. Selecting a counter causes the appropriate help text to appear.
      Windows NT actually allows some explanatory text to be associated with the Object itself in addition to its counters, but PerfMon doesn't offer any way to display help text for objects, just counters. Hopefully, this help text will become displayable in future versions of PerfMon (or, more likely, the Microsoft® Management Console).
      At this point, I've discussed the most important fields of this dialog box. The remaining fields are all related to PerfMon's user interface. Once you have selected a computer, object, instance (if applicable), and counter, you then select how you want this information charted in PerfMon. Each instance/counter value will be charted as a separate line. You get to select the color, width, and style of each line. The last field, scale, allows you to specify a multiplier that will be applied to the counter's value. You can use this value to be sure that the counter's line is always visible on the chart.
      When you are adding counter information to PerfMon's chart, you can select multiple entries in the Instance and Counter listboxes. The number of lines that will be charted in PerfMon is the product of the number of instances and the number of counters.
      Notice that some objects that support instances include a pseudo-instance called _Total. This is not actually an instance of the Object; it's there to make it easy for you to see the total value of the counter for all instances of the Object. For example, selecting the Page Faults/sec counter for the Process object's _Total instance causes PerfMon to shown the Page Faults/sec for all processes.
      Be aware that for some counters, displaying a total makes no sense. It makes no sense to show the process ID for all process instances. If you tell PerfMon to chart this counter, it simply shows a value of zero.

Performance Monitoring From a Designer's Perspective
      There are many reasons to consider adding performance counter information to your own applications. First and foremost, you want to make it easy for administrators and helpdesk people to check on the health of a computer system. For most applications, you do not want to bog down users with a bunch of statistical information that is meaningless to the M. It would be much better to expose information with performance counters; this way, the people who have the ability to do something with the information can easily access it.
      Also, Windows NT makes the performance information available across the network. As I mentioned in the previous section, a person using the PerfMon tool has the ability to select the computer from which to collect the information. By exposing your application's information using the Windows NT built-in performance monitoring facilities, your information is accessible remotely without any additional work from you.
      One thing that turns a lot of people off to performance monitoring is performance. Obviously, performance monitoring is not free. Somewhere inside your application you need to have a block of memory that stores current counter data. Periodically, your code must update the Se values. That means that your code is going to be larger and will execute slower, something you always try to avoid. If performance monitoring affected the system drastically, no one would use it. Certainly the speed of performance monitoring was a big issue when Microsoft designed this stuff into the system.
      To minimize this problem, decide carefully what it is you want to monitor. If you have a tight calculation loop, avoid updating counters while inside this loop. On the Other hand, you might be writing the server side of a client/server application. You might want to keep a performance counter that tracks how many clients have connected, how many clients are currently connected, the number of bytes received per client, the number of bytes sent per client, what types of requests your clients are making, and so on. Internet Information Server keeps track of exactly this type of information.
      For software developers, performance monitoring can be an awesome tool. On the Platform SDK CD-ROM, there is a sample program called LeakyBin. This program demonstrates how to expose counter values by creating a value that increases every time memory is allocated and decreases every time memory is freed. If you run LeakyBin, you will see a line in PerfMon that reflects the memory allocations made by the application. LeakyBin purposely has a bug in it that prevents memory from being freed, so in PerfMon you will see a line that is always increasing. The developer or tester could easily monitor this to be sure that the application behaves correctly.
      To demonstrate performance monitoring, I wanted to write a sample program that created a Stock object. This object would have one instance in it for each stock symbol. The counters would be information about the stock, like last price, highest price, lowest price, P/E ratio, and so on. In the sample program, you would select the stocks of interest. The application would gather this information over the Internet and make it available using PerfMon's charting facilities. Unfortunately, I could not find an Internet site that would allow me to legally produce a derivative work from their stock ticker information. So the sample application presented here is different. This should give you a good idea for what you could do with Windows NT performance monitoring.

The Architecture of Performance Objects and Counters
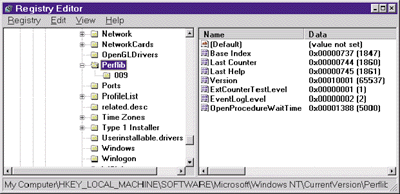
      To expose your own performance information, you must make several modifications to the registry. You can think of the Se modifications as falling into two groups: the first set tells the system that your counters exist; the second set tells the system how to get the performance information for your counters. The first set of modifications are performed under the registry subkey HKEY_LOCAL_MACHINE\SOFTWARE\Microsoft\Windows NT\CurrentVersion\Perflib (see Figure 4). Under the Perflib subkey is another subkey, 009, which corresponds with the LANG_ENGLISH symbol defined in WINNT.H. Under the 009 subkey are two values: Counter and Help. Both of the Se values are of the REG_ MULTI_SZ type. The Counter value contains a set of strings that define the Objects and counters that you want to make the system aware of. Figure 5 shows a small sampling of the strings in this value. The Help value contains a set of strings that explain the meaning of a Performance object or counter. Some are shown in Figure 6.
      You'll notice that the Counter value strings are in pairs. Each pair consists of an even number and a short string. The Help value strings are also in pairs, but the numbers are odd. The text in the Counter value is what PerfMon shows in its Add to Chart dialog Object and Counter fields. If you press the Explain button in PerfMon, it will take the even number identifying the counter, add one, look up the explanation text from the Help value and display this text in the Counter Definition area. As I mentioned earlier, PerfMon currently has no way of showing the help text for performance objects. This means that you'll never see the help text associated with numbers 3 and 5, for example.

Figure 4 Perflib Registry Subkeys

      To add your own performance objects and counters to the system, you must append your objects, counters, and help string pairs to the Se two registry values. Referring back to Figure 4, you see two values under the Perflib subkey: Last Counter and Last Help. the Se two values tell you the highest number that has been used in the Counter and Help values. In my registry, the last counter has a value of 1860, so any new objects or counters that I would add to the system should start at 1862. Similarly, my new help text should start at 1863. Microsoft reserves a certain set of numbers for Windows NT itself. The Base Index value (1847) indicates the highest number that Microsoft has reserved for the system's own objects and counters. Objects and counters that you add must be above this number.
      You'll also notice in Figure 4 that there are three subkey values that may not exist on your system. You can find documentation for the Se values by looking in Chapter 10 of the Windows NT Workstation 4.0 Resource Kit.
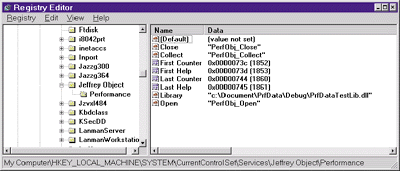
      Now, let's turn to the Other part of the registry. To expose your own performance objects, instances, and counters, you must create a DLL responsible for returning your performance information. Once the DLL is created, you must tell the system about it by making some more modifications to the registry. the Se modifications are made in a different part of the registry, however: HKEY_LOCAL_MACHINE\ SYSTEM\CurrentControlSet\Services\JeffreyObject\ Performance (see Figure 7). The Jeffrey Object portion of this subkey is the part that uniquely identifies my performance data. You will, of course, replace this portion of the subkey with the name that uniquely identifies your performance data.
Figure 7 Adding Objects to the Registry

      Within this subkey, there are several data values. The most important value, Library, specifies the path name of the DLL that knows how to return your performance information. This DLL must export three functions: an Open function, a Collect function, and a Close function. You can choose any names for the Se functions that you want, but the names must be specified using the Open, Collect, and Close values in the registry.
      When performance information is being requested, the system will load your DLL and immediately call its Open function. Your Open function must look like this:

 DWORD __declspec(dllexport) WINAPI Open(
     LPWSTR lpDeviceNames) {
     // Note: for applications, lpDeviceNames is always
     // NULL.
     // Initialize the DLL
     return(ERROR_SUCCESS);
 }
This gives your DLL the Opportunity to initialize itself. Once initialized, the system will periodically make calls to your Collect function. This function is responsible for initializing a memory buffer that contains all of the performance information you wish to return. I will discuss the prototype of the Collect function and go into much more detail of its implementation shortly.
      When the system decides to unload your DLL, it calls your Close function, giving you the Opportunity to perform any necessary cleanup. Your Close function must look like this:

 DWORD  	__declspec(dllexport) WINAPI Close(void) {
     // Cleanup the DLL
     return(ERROR_SUCCESS);
 }
      The four registry values that I have discussed so far are the Only ones required by the system. However, it is frequently useful to have some additional registry values as shown in Figure 7. As mentioned earlier, when you add new performance objects and counters to the system, you must append your performance object and counter strings to the registry. the Se new strings must begin with unique numbers. It is absolutely essential that your performance DLL remember what object and counter numbers it has been assigned. The easiest place to remember this information is in the Performance registry subkey. Figure 7 shows that I have added the First Counter, Last Counter, First Help, and Last Help values to the registry for just this purpose. When my DLL loads, I open the registry, extract the Se values, and save the M for reference by my Collect function. It is necessary to know your object and counter numbers because the system passes the M to your Collect function to identify which performance information you should return.
      You're probably wondering which process your DLL gets loaded into. There are two possible scenarios. The first scenario is when your performance information is being queried locally. For example, when PerfMon is used to query performance information from the local machine, the system loads your DLL into PerfMon's address space. Because you're running in another process's address space, it is critically important that you test your code thoroughly and make sure that it is very robust. If your code contains any infinite loops, calls ExitProcess, or deadlocks waiting for some thread synchronization object, you'll be adversely affecting PerfMon.
      Over the years, Microsoft has made PerfMon more robust to withstand this kind of passive-aggressive behavior. For example, PerfMon now spawns a separate thread when calling into a DLL's Collect function. If that thread doesn't return in a fixed amount of time, PerfMon can kill that thread and continue running. PerfMon does not directly call the Open, Collect, or Close functions. Instead it calls RegQueryValueEx with HKEY_PERFORMANCE_DATA. This call into ADVAPI32.DLL gets routed to a statically linked library, PERFLIB, that will call the Open, Collect, or Close functions. By the way, PERFLIB is the source name PerfMon uses when posting errors to the Eventlog.
      A slightly different scenario exists when your performance information is being queried by a remote computer. Here, the remote computer is actually talking to an RPC server contained inside WinLogon.exe. When WinLogon detects a request for performance information, it will load your DLL into its address space. The information that you return from the Collect function is then remoted to the machine making the request. All of this happens transparently to you.
      Be aware that being loaded into WinLogon's address space is much more severe than being loaded into PerfMon's address space. If your DLL calls ExitProcess, you will terminate WinLogon, which will, in turn, crash the entire operating system. Again, I cannot stress enough how important it is to test the code residing in your performance DLL.

Collecting Performance Data
      An application like PerfMon requests performance information by making registry calls. To collect performance information, the requesting application must first call RegQueryValueEx as follows:


 // Allocate the buffer.
 AllocSize = BufferSize;  // initial allocation size
 
 PerfData = (PPERF_DATA_BLOCK) malloc( AllocSize );
 while(RegQueryValueEx(HKEY_PERFORMANCE_DATA,
                       "Global",
                       NULL,
                       NULL,
                       (LPBYTE) PerData,
                       &BufferSize)==ERROR_MORE_DATA){
     // Get a Buffer that is big enough.
     //increment the allocation size
     AllocSize+=BYTEINCREMENT; 
     PerfData=(PPERF_DATA_BLOCK)realloc(PerfData,   
                                        AllocSize );
     //tell RQVex how big the buffer is 
     BufferSize = AllocSize;
 }
 //because RegQueryValueEx modifies the
 //data in BufferSize, reset it to the
 //proper value for the buffer size
 BufferSize = AllocSize;
 .
 .
 .
      To repeatedly request performance information, just keep calling RegQueryValueEx. The "Global" in the call to RegQueryValueEx tells the system that you want performance information returned for all components in the system. This can be a lot of information; if you want a small subset of the available information, simply replace "Global" with a set of object numbers. For example, if you want the performance information for the System and Memory objects, you would pass a string of "2 4" to RegQueryValueEx. You always pass object numbers to RegQueryValueEx, and the corresponding DLL always returns all the counter and instance information associated with the specified object.
      If an application wants to request performance information from a remote computer, all it has to do is call RegConnect- Registry before entering the while loop.

 RegConnectRegistry("\\\\RemoteMachineName",
                    HKEY_PERFORMANCE_DATA, &hkeyPerf);
If you're not going to make any more requests of performance information, you should close the registry with the following call:

 RegCloseKey(hkeyPerf);
Make this call even though you never call RegOpenKeyEx to explicitly open this key. And don't close the key after every call to RegQueryValueEx because it'll degrade performance severely. It is best to just close it once, usually just before your application terminates.
      When PerfMon (or any application) calls RegQueryValueEx to request performance information, the system looks in the target machine's HKEY_LOCAL_MACHINE\SYSTEM\CurrentControlSet\ Services subkey. For each entry that contains a Performance subkey, the system loads the specified DLL. If this is the first time the DLL is loaded, the DLL's Open function is called.
      Once loaded and initialized, the system calls each DLL's Collect function. This gives the DLL the chance to load the memory buffer with its performance information. The Collect function must look like this:

 DWORD __declspec(dllexport) WINAPI Collect(
     LPWSTR lpValueName, LPVOID* lppData, 
    LPDWORD lpcbTotalBytes, LPDWORD lpNumObjectTypes) {
 
    // Collect the performance data
    return(ERROR_SUCCESS);   // or ERROR_MORE_DATA if  
                             // buffer is too small
 }
The first parameter, lpValueName, is a Unicode string that is the same value that was passed to RegQueryValueEx. If this string is "Global," then the Collect function must return all of the performance information that it is responsible for. If the string contains a set of space-delimited numbers, then the DLL must determine if the Objects that it offers information about was requested and, if so, return only this information.
      The lppData parameter is a pointer to a memory address. On input to this function, *lppData points to the memory buffer where the DLL should write its information. Before returning from this function, the *lppData should be updated so that it points to the memory address immediately following the new data that was placed into the buffer. The next performance DLL will append its data starting at this new address.
      The lpcbTotalBytes parameter is a pointer to a DWORD that indicates the size of the buffer. On input, *lpcbTotalBytes indicates the number of bytes that are available in the buffer for your DLL to add its information. After placing your information in the buffer, set *lpcbTotalBytes to the total number of bytes that your DLL added to the buffer. When Collect returns, the system will subtract this value from the remaining buffer size and pass this new number to the next performance DLL.
      The lpNumObjectTypes parameter also points to a DWORD, but this DWORD means nothing on input to the Collect function. A single Collect function can return performance information for several objects. Before Collect returns, *lpNumObjectTypes should be set to the number of objects whose performance information was added to the data buffer.
      If, for example, your Collect function is called and the lpValueName parameter doesn't indicate any of the Objects your DLL is responsible for, your Collect function should leave *lppData unchanged, set *lpcbTotalBytes and *lpNumObjectTypes to 0, and return ERROR_SUCCESS.
      If your Collect function is called and the lpValueName parameter indicates objects that your DLL is responsible for, but determines that the data buffer is too small for the amount of data you need to return, you should leave *ppbData unchanged, set *lpcbTotalBytes and *lpNumObjectTypes to 0, and return ERROR_MORE_DATA.
      If your Collect function does successfully append information to the buffer, then it adds the number of bytes appended to *ppbData, sets *lpcbTotalBytes to the number of bytes appended, sets *lpNumObjectTypes to the number of objects added, and returns ERROR_SUCCESS.

Performance Information Data Structures
      At this point, the Only thing that I haven't covered is the format of the performance information that goes into this data block. Unfortunately, the data block contains a set of different data structures, some of which are variable length. This makes building the contents of this data buffer difficult at best. Figure 8 shows how the performance information is laid out for an object. This particular object doesn't support instances, but does support two counters. This means that three string entries exist in the registry for this object: one string identifies the Object name; two other strings identify the counter names.
Figure 8 Performance Info
      To report performance information for this object, the data block passed to the Collect function must first have a PERF_OBJECT_TYPE structure placed into it. You can look up the meaning of this structure's members in the Win32® documentation, so I'll only describe the members briefly in Figure 9.
      Immediately following the PERF_ OBJECT_TYPE structure is one or more PERF_COUNTER_DEFINITION structures (see Figure 10), one structure for each counter offered by the Object. Each PERF_COUNTER_DEFINITION structure defines characteristics of a single counter but the actual value of the counter is not returned inside one of the Se structures. After the PERF_ OBJECT_TYPE structure and all the PERF_COUNTER_DEFINITION structures, there is a single variable-length PERF_COUNTER_BLOCK structure. The first member, ByteLength, indicates how many bytes are in the struct (this number must include the four bytes for the ByteLength member itself). The counter values immediately follow the ByteLength member. It is critically important that each new value is aligned on a 32-bit boundary or alignment violations will occur on RISC platforms.
      Inside the PERF_COUNTER_DEFINITION structure, the CounterSize member indicates how many bytes are used by the counter value, and the CounterOffset member indicates the Offset of where the counter value is inside the PERF_COUNTER_BLOCK structure.
Figure 11 Supporting Instances
       Figure 11 shows how the performance information is laid out for an object that supports instances. This particular object offers one counter for each instance and currently has two instances defined. Because there is only one counter defined, only two string entries exist in the registry for this object: one identifies the Object name; the Other is the counter name. There are also two help strings.
      The beginning of this memory block is laid out just like the previous example. It begins with a PERF_ OBJECT_TYPE structure followed by one PERF_COUNTER_DEFINITION for every counter offered by the Object. This is where the similarity ends. Since this object supports instances, the PERF_COUNTER_DEFINITION structures are followed by one PERF_ INSTANCE_DEFINITION structure for each instance currently existing for the Object. The members of the PERF_ INSTANCE_DEFINITION structure are described briefly in Figure 12.
      Immediately following the fixed portion of the PERF_INSTANCE_DEFINITION structure is the variable-length portion, which contains the Unicode string name for the instance terminated with a 0 character. If the name contains an odd number of characters (including the 0 character), you must add another two bytes of padding so that the following PERF_COUNTER_BLOCK structure begins on a 32-bit boundary. If the instance name is an even number of characters, no padding is required.

The CPrfData C++ Class
      To make it easy to add performance objects and counters to your own applications or services, I've created a C++ class called CPrfData. This class does all of the really tedious work such as shared memory management, data structure initialization, memory block construction, adding and removing object instances, and registry handling. With this class, the hardest part of adding performance information to your code will be deciding which objects and counters to expose.
      Due to space limitations, I will not describe how all of the functions in the CPrfData class work. The source code and its comments speak for the Mselves. However, I will explain the steps that you'll have to take to use the C++ class properly. In fact, I offer a sample application, Hardware Input Monitor (HWInputMon.exe), that fully exploits the capabilities of my CPrfData class. I strongly urge you to download the complete Visual C++® 5.0-based workspace, build it, experiment with it and take the pieces that you need so that your own applications can expose performance objects and counters.
      To create an application (or service) that exposes performance information, you will need two projects: a Win32-based application project that is the executable application itself, and a Win32 DLL project that exposes the performance information. Both of the Se projects should include the files listed in Figure 13, which I am providing with this article.
      Once you have the Se two projects set up, create a header file that defines programmatic symbols for the specific objects and counters that you want your application to expose (see Figure 14). You define an object's symbol using the PRFDATA_DEFINE_OBJECT macro (defined in PrfData.h). This macro takes two parameters: a symbolic name that you can use in your application to refer to this object, and an ID that you define. The ID must not be 0 and must never be repeated. You define a counter in exactly the same way, except you use the PRFDATA_DEFINE_COUNTER macro. Any source code modules that change or update a performance counter must include this header file.
      Next, you'll need to create a table indicating what objects and counters your application supports (see Figure 15). The table is easily created using macros declared in the PrfData.h header file. the Se macros create what I call a performance data map, similar to the message maps used by programmers working with MFC.
      You begin a performance data map using the PRFDATA_ MAP_BEGIN macro, which instantiates an array of structures that defines your objects and counters. After the PRFDATA_MAP_BEGIN macro, you can use one or more PRFDATA_MAP_OBJ or PRFDATA_MAP_CTR macros. the Order of the entries in the map is important. An object must be declared first, followed by any counters for that object, then another object may be declared with its counters, and so on.
      To declare an object, use the PRFDATA_MAP_OBJ macro. This macro requires seven parameters:

  • A programmatic symbol that identifies the Object
  • A Unicode string name for the Object (this will be added to the registry)
  • Unicode help text for the Object (also added to the registry)
  • the Object's detail level
  • A programmatic symbol name of the counter that should be selected by default when this object is selected in PerfMon
  • The maximum number of instances that this object supports (pass PERF_NO_INSTANCES if this object doesn't support instances)
  • The maximum number of characters that can appear in an instance's string name (pass 0 if the Object doesn't support instances)
      After you've added an object to the map, you must add one or more counters for this object by using the PRFDATA_ MAP_CTR macro. This macro requires six parameters:
  • A programmatic symbol that identifies the counter
  • The Unicode string name for the counter (this will be added to the registry)
  • Unicode help text for the counter (also added to the registry)
  • The counter's detail level
  • The default scale for the counter
  • The type of counter
      Finally, after you have added all of the Objects and counters to the map, you must end the map using the PRFDATA_MAP_END macro. This macro takes just one parameter: the name of your application. This name is used to create your counter information in the registry key HKEY_LOCAL_MACHINE\SYSTEM\CurrentControlSet\ Services\AppName\Performance. This macro terminates the map and creates a global instance of the CPrfData class. The global instance is called g_PrfData and you will have to refer to this variable within your code when you want to manipulate the performance objects, instances, or counters.
      Notice that the performance data map is placed in a source code file all by itself. This is necessary because both the application and the DLL will have to include this file in their projects.
      Now, let's look at some code that demonstrates how to use the CPrfData class's public member functions: the WinMain function inside HWInputMon.cpp (see Figure 16). For the application to expose performance information, the registry must be configured as described previously. CPrfData has a static member function called Install.

 void CPrfData::Install(LPCWSTR pszDllPathname);
This function must be passed the full path name of the DLL that exposes your performance information. In WinMain, you can see that my application calls this function if -Install is passed as a command-line switch. In this case, I get the full path name of the executable file, replace the EXE file name with the DLL file name, and then call this function. This, of course, assumes that the EXE and the DLL are in the same directory. If you add performance information to your own application, you may want to have your setup program run the application with the -Install switch.
      If the user wants to remove the application from their system, call CPrfData's Uninstall function:

 void CPrfData::Uninstall();
In WinMain, I call this function if -Uninstall is passed on the command line. This causes all of the registry information to be deleted. When you're debugging counters, you may want to have your application install the registry information on startup and uninstall it during shutdown. This way, if you decide to add, delete, or move any of the entries in the performance data map, the registry will not get out of sync.
      If the application is just going to run as normal, then the CPrfData class's Activate function must be called:

 DWORD CPrfData::Activate();
This function allocates the shared memory block and initializes it with the information contained in the performance data map. An application must only call this function after the performance information has already been installed.
      Once the performance data has been activated, WinMain adds instances to one of its objects. Instances are added simply by calling the AddInstance function:

 INSTID CPrfData::AddInstance(OBJID ObjId,
                              LPCWSTR pszInstName,
                              OBJID ObjIdParent = 0, 
                              INSTID InstIdParent = 0); 
The first parameter is the programmatic symbol used to identify the Object that is to get the new instance; the second parameter is the Unicode string name of the instance. The last two parameters allow you to indicate that this instance is the child of some other object's instance. Most instances do not have parent instances, so you will usually pass just the first two parameters to this function. If the function is successful, it returns an INSTID. This is my own data type that is simply a handle to the newly created instance. If the function fails, -1 is returned.
      The CPrfData class has another version of AddInstance that's identical to the first except that it allows you to identify the instance using a unique ID instead of a Unicode string.

 INSTID CPrfData::AddInstance(OBJID ObjId,
                              LONG lUniqueId,
                              OBJID ObjIdParent = 0,
                              INSTID InstIdParent = 0);
Instances can come and go as your application executes so you should feel free to add new instances at any time. You can also remove instances by calling RemoveInstance:

 void CPrfData::RemoveInstance(OBJID ObjId, 
                               INSTID InstId);
      Now I can get to the fun stuff: changing a counter's value. Two functions exist that allow you to alter a counter's value.

 LONG&    CPrfData::GetCtr32(CTRID CtrId, 
                             int nInstId = 0) const;
 int64&   CPrfData::GetCtr64(CTRID CtrId,
                             int nInstId = 0) const;
If the counter value you want to change is 32 bits wide, call GetCtr32; if the counter value is 64 bits wide, call GetCtr64. In debug builds, my source code will raise an assertion if you accidentally call a function that doesn't match the counter value's width. To both of the Se functions, you pass the programmatic symbol for a counter that you've defined. If this counter is inside an object that doesn't support instances, leave off the second parameter. If this counter's object supports instances, then you must pass the INSTID (returned from AddInstance) as the second parameter.
      the Se functions return either a LONG reference or an __int64 reference that identifies the counter's value inside the shared memory block. With this reference, it is trivial to change the value of a counter. Here is an example:

 LONG& lCounterValue =
     g_PrfData.GetCtr32(SOME_COUNTER_SYMBOL);
 lCounterValue = 5;    // Make the counter's value 5
 lCounterValue++;      // Add 1 to the counter's value
 lCounterValue *= 13;  // Multiply the counter's current
                       // value by 13;
Just sprinkle lines like the Se through your application's source code whenever you want to change the value of a counter. the Se lines of code execute very quickly and should not hurt the performance of your application significantly.

Synchronizing Access to the Counter Values
      Synchronizing access to the counter values is an issue that every programmer should certainly take seriously. To implement counters correctly, you should wrap each modification of a counter value inside a critical section or something similar. As I've mentioned in previous Win32 Q&A columns, a critical section usually takes about 10 CPU instructions to enter, whereas adding a value to a counter can usually be done in one or two CPU instructions. As you can see, the Overhead of properly synchronizing access to a counter value is quite significant.
      This concerned me, so I spoke to a developer at Microsoft who is familiar with Windows NT performance issues. He told me that most of the system counters do not synchronize access to the counter value. This reduces the Overhead of properly synchronizing the value, but means that the value could potentially become corrupted. This is such an unlikely scenario that it was decided that the speed benefit far outweighed the possibility of presenting inaccurate information. Yes, it is possible that PerfMon may occasionally show an incorrect value and this may throw off the statistics, but this was deemed by the Windows NT team to be okay.
      From the experience and testing that I've done when creating my own performance objects and counters, I must concur with the Windows NT team; that is, the Overhead of properly synchronizing access to a counter value versus the potential of an incorrect value being seen by PerfMon is not worth the Overhead.
      However, when designing my C++ class I felt it was necessary to let you decide for yourself whether synchronizing access to counter values verses the speed of updating that value is important. For this reason, my C++ class offers three public functions that allow you to lock or unlock the counters if you feel that is necessary:


 void CPrfData::LockCtrs() const;
 BOOL CPrfData::TryLockCtrs() const;
 void CPrfData::UnlockCtrs() const; 
Most applications will not use the Se functions. However, I do call the Se functions inside the implementation of my CPrfData class itself. For example, my implementation of the Collect function always locks and unlocks the counter information when called. I felt that this was necessary because the Collect function has a lot of work to do and the additional overhead is insignificant compared to the Other instructions that will execute when collecting the data.
      In addition, I also lock the shared memory block when I add or remove object instances. This prevents the data structures from becoming corrupt and my code from crashing. The HWInputMon.cpp module also demonstrates the Se functions from inside the WinMain function.
      One important note: since threads running in different processes access the shared memory block, the easy way to synchronize the Se threads would be to use a mutex kernel object. But waiting on a kernel object requires about 600 CPU instructions. I'd get much better performance if I could use a critical section. Unfortunately, critical sections can only be used to synchronize threads that are running in a single process. Since I want very high-speed mutual exclusive access to the shared memory buffer from threads in multiple processes, I decided to synchronize access to the shared memory buffer using my COptex class described in my January 1998 Win32 Q&A column.

Performing at Your Very Best
      Please examine my source code for more information about using the CPrfData class and to see how the workspace and its projects are configured.
      Once you start exposing performance information from your applications, I'm sure your imagination will start to run wild with cool things you can do. It is unfortunate that Microsoft has made it so difficult to expose your own counters and that my code needs to be around 1500 lines long to solve this problem (albeit in a general way). I hope that with my code, you can start adding performance counters to your own applications quickly and easily.

From the August 1998 issue of Microsoft Systems Journal.