October 1998
![]()
An Inside Look at Developing Applications Using the New Features of Visual C++ 6.0
Download Oct98InsideLook.exe (325KB)
Joe Massoni is the Microsoft Technical Support lead for Visual C++ 6.0. He has worked in software development for ten years; the last six have been in Microsoft Technical Support. Joe can be reached at joemas@microsoft.com.
|
As the
Microsoft® Technical Support lead for Visual C++® 6.0, I spend a lot of time talking to our customers. When it comes to revisions, our customers want a painless upgrade, faster and easier application development, and no surprises. Visual C++ 6.0 delivers on all three. The new features are so seamlessly integrated that sometimes people don't even realize they are using them. Let's go over some of the
more exciting new features in
Visual C++ 6.0. I won't attempt to provide a complete list.
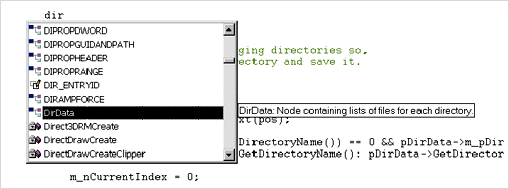
I'll start with a quick overview of the things you'll see when you first start up Visual C++ 6.0. Your first impression may be that the IDE looks pretty much the same as the previous version, and you'd be right. It's hosted in the MSDEV shell that was introduced in Visual C++ 4.0. Now try loading up a project. Porting your Visual C++ 5.0 workspace to Visual C++ 6.0 will most likely be very easy. Basic functionality in the build system has not changed, although there are some nice additions to the object model. When you fire up the compiler and rebuild your application, you might get some new warnings. Most likely the compiler will catch things you may have neglected such as an incorrect or missing assignment, or an unreferenced variable. The compiler team has worked very hard to improve the warning messages. In addition, you should see improved throughput, especially with debug builds of large applications. To continue exploring the new features, add some new code to your application. By default, Visual C++ 6.0 will add some new switches to your project settings and workspace that enable the Automatic Statement Completion and Edit and Continue features. If you're adding a function call to a subroutine, the Automatic Statement Completion (ASC) feature will present a prompt like that shown in Figure 1. |
 |
| Figure 1 Automatic Statement Completion |
|
New Compiler Switches and Warnings
|
|
| This code will work if you turn off string pooling, but it's not considered a good programming technique. If you need to modify your strings, you should allocate them in the heap.
There is another potential downside to using the /ZI option: OBJ files are approximately 35 percent larger. I suspect that there is a build speed hit as well, but the Edit and Continue feature speeds up the build cycle sufficiently so that you'll probably find the tradeoff worth it. The new /GZ switch enables runtime debug checks to catch bugs such as uninitialized pointers, that are usually only exposed in release builds. This switch is on by default in newly created AppWizard applications, but does not show up when you port an application. The /GZ option complements other warnings such as C4700 (local variable name used without having been initialized) and C4701 (local variable name may have been used without having been initialized) by setting uninitialized variables to 0xCCCCCCCC. So if you've forgotten to initialize a pointer, an exception will be thrown when your application tries to access memory located at this address. Of course, this is a perfectly fine value for an integer, which is where the C4700 warning comes in. Besides catching uninitialized pointers, /GZ will check your stack upon returns from function calls, and at the end of functions that throw an exception if the stack is out of whack. Figure 2 is a small sample that illustrates most of /GZ's capabilities. The lines that begin with —> represent the /GZ checks. If MyFn is called through a normal function call, there is no need to insert the stack-checking lines shown in the section that starts with "Line 18." Have you ever gotten frustrated trying to disable warnings, just to discover that they get turned on somewhere else? Or maybe the warning was off and you didn't know it. The pragma warning (push) and (pop) will help control this. |
Built-in MIDL Support The inability of the AppWizard system in Visual C++ 5.0 to recognize Interface Definition Language (IDL) files was a real problem for developers using custom projects. If you have Visual C++ 5.0-based Active Template Library (ATL)-based applications, or any Visual C++ 5.0 application that uses IDL files for standard COM, you can take advantage of the new, built-in support for Microsoft Interface Definition Language (MIDL). To do this in your ported app, open up your Project Settings dialog, select the IDL file in the file tree on the left, make a note of your current custom build rules, and de-select the "Always use custom build step" option in the General tab. Note that the MIDL support does not include Remote Procedure Calls (RPC). You will have to use custom build rules for RPC. The built-in MIDL support ensures that the files are built in the correct order; you won't have to compile the IDL file in a separate step. Dependencies are maintained by the project system so you don't have to compile manually. Also, there is a user interface to help you modify MIDL commands.
Dependencies for Makefiles
|
|
|
This setting is controlled by the "Allow per-configuration dependencies" checkbox in the General page of your Project Settings dialog. Selecting this checkbox will change the value to 1, but won't do anything during an IDE build of your project.
If you need to export your makefile, this switch will create a dependency (DEP) file as well. DEP files include dependency information for each file in your project on a by-configuration basis. Like the MAK file, the DEP is a text file that you can modify as needed.
Command-line Builds
|
|
|
This command line generates a log (see the /OUT wincrc.log argument), so if you have a large project that builds overnight you'll get a log of the errors. Also, the build is batched—all the CPP files are passed to the compiler at once. This is faster than invoking the compiler on a per-file basis, common for a MAK file project.
You can use environment variables to adapt to environments that are a little different. There is an MSDEV command-line switch (/USEENV) that directs Visual C++ to use the current environment settings for SOURCE, PATH, LIB, and INCLUDE rather than the settings in the IDE's Directories dialog box. This switch was designed specifically for command-line builds, and is not recommended for use when running the IDE as an editor. If you run the Visual C++ environment with this switch, the IDE will continue to use the environment settings, with or without the /USEENV switch. To turn this off, you must delete the registry key HKEY_CURRENT_USER\Software\Microsoft\Devstudio\6.0\Build System\Use Environment Paths. To use different paths when running the Visual C++ environment, you should use the /I switch that is described in Knowledge Base article Q127200, "HOWTO: Use Other Registry Keys with Visual C++ 2.0 and Above." New MFC projects that build context-sensitive help use custom build rules that give the IDE more control over the build process than provided by a batch file. Visual C++ 6.0 does create a MakeHelp.bat file in case you need it. You'll notice that the online documentation for Visual C++ 6.0 and Visual Studio® uses the HTMLHelp viewer in MSDN.™ If you want to write help files for HTMLHelp rather than WinHelp (which is the default for MFC-based projects), refer to the online help topic titled "Help Topics (HTML Help): Context-Sensitive Help for Your Programs."
Compiler Throughput
|
|
Visual C++ 5.0 3:52 ± 2 sec Visual C++ 6.0 3:51 ± 1 sec |
| Obviously, this was not what I expected. Then I checked the settings and realized that I was using /YX (automatic use of precompiled headers), something that I've noticed users do quite frequently. This switch is not recommended since it incurs obvious overhead. To avoid this, I changed the project settings to use /Yc (create precompiled headers) and /Yu (use precompiled headers). The build times were now:
|
|
Visual C++ 5.0 3:30 ± 1 sec Visual C++ 6.0 2:59 ± 1 sec |
| This showed a 14.6 percent improvement and demonstrates the importance of /Yc and /Yu.
Linker Enhancements
|
|
| The output includes a section that contains the following delay load imports: |
|
| So the correct case for the argument to __FUnloadDelayLoadedDLL is MyDll.dll.
IntelliSense
|
 |
| Figure 5 Code Comments |
|
|
 |
| Figure 6 Dynamic Parsing |
|
|
 |
| Figure 7 Function Tooltip |
|
New Object Model Methods
Debugger Edit and Continue
Other Debugger Features
|
 |
| Figure 9 Debugger Auto Window |
|
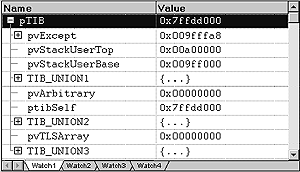
There are also two new pseudoregisters: ERR and TIB. ERR picks up the last error code for the current thread, which can be extremely helpful. TIB displays the address of the Thread Information Block (also known as the Thread Environment Block). Just knowing the address often isn't enough, so I've found it useful to include Matt Pietrek's TIB.H file, which defines the TIB structure (see "Under the Hood," Microsoft Systems Journal, May 1996). You'll need a pointer to the TIB in order to spy on it. For example, you could add the following code to your app: |
| Now when you need to know what's in the TIB, you can assign the address to pTIB and display the TIB structure in a watch window as shown in Figure 11. |
 |
| Figure 11 TIB Struct |
|
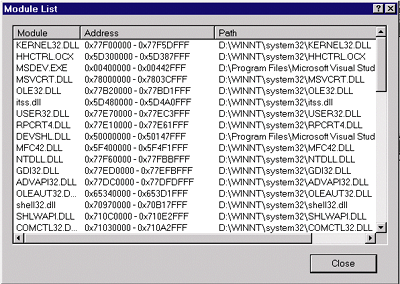
Another useful feature added to the debugger is the module list. During the Visual C++ beta I ran into a problem where MSDEV crashed upon exit. It looked like MSDEV had a nasty bug, so I attached the debugger from one instance of MSDEV to another and took a look at the Debug.Modules dialog (see Figure 12). It was interesting to see the other modules that were a part of MSDEV's process. Any one of these could be the culprit. In this case the error message pointed to KERNEL32.DLL. I doubted that the bug was in KERNEL32, so I needed to see what was on the stack at the point of the crash. |
 |
| Figure 12 Module List |
|
In the debugger, I went to the offending line of code by using Ctrl+G to jump to 0x77FO5149. This showed: |
|
| Seeing that ECX was getting set to zero, I set a conditional breakpoint to break when ECX == 0. When the error reproduced, I took a look at the call stack and found that the problem was HHCTRL.OCX (see Figure 13). |
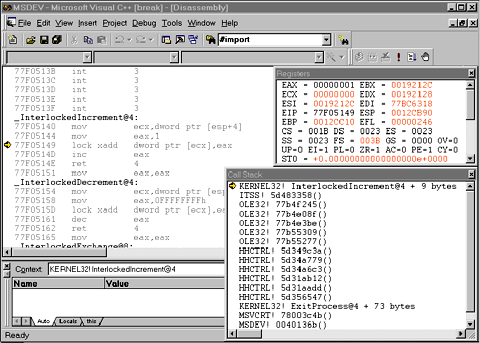 |
| Figure 13 Call Stack |
|
While most of the techniques I used are not new, having the address ranges of the modules in MSDEV helped me decide the course of action I needed to take to find the problem. While in this particular illustration the module list was not essential, it was informative and provided a more complete view of the running application.
New AppWizards
Win32 Static Library
|
|
|
Click on Yes, then Select OK in the dialog box titled Select Source Files – MyLib.clw. Bingo! You're in the MFC Class-Wizard dialog box. Now when you go into the New Class dialog box you'll see MFC Class as your primary option.
C Runtime Library
|
| Time (in seconds) | ||
| Visual C++ 5.0 | Visual C++ 6.0 | |
| First run (not cached) | 70 sec | 33 sec |
| Subsequent runs (cached) | 29 sec | 1 sec |
|
Of course, you won't see results this dramatic in a real-world application. In fact, you may not notice any benefit if your application just creates a window and does few allocations. If you are allocating a lot of memory over and over again, you should see some benefit.
I did not measure performance using low memory conditions that would force hard drive (swap file) access, like users would experience if they were running several applications at once. So I don't know what effect this would have on performance. One reason for the increased performance involves including control structures along with the allocated memory. Previous to Visual C++ 6.0, the control structures were located in tables outside of the heap. Data overwrites occasionally existed without apparent mishaps. The new heap manager is less tolerant of memory errors in your application. Since the heap is such a focal point in any application, it is important to make sure your application works correctly. To diagnose heap errors you need to enable the debug heap by calling _CrtSetDbgFlag. For more information, please see the online documentation titled "Using the Debug Heap" and the Knowledge Base article at http://support.microsoft.com/support/kb/articles/q190/5/36.asp.
MFC and ATL
Enterprise Features
Wrap-up
From the October 1998 issue of Microsoft Systems Journal.
|