Greater Office
By Rick Dobson, Ph.D.
Visio is the name of the company, and also serves as the name of its flagship product. Visio is elegantly simple in design: You draw things by dragging SmartShapes from a stencil and dropping them on a drawing. SmartShapes behave much like the classes that VBA developers regularly use. These shapes have properties, methods, and even events. In addition, you can create your own SmartShapes for custom applications.
Visio enables you to draw just about anything, but its built-in collections of SmartShapes and wizards for specific tasks can revolutionize some tasks — and drastically simplify others. When flowcharting, the connecting lines join shapes no matter how you position the shapes. Shapes can also read remote ODBC data sources, refresh themselves from the data sources, and update values in them. Furthermore, the product's wizards help create Excel workbook files on-the-fly.
Visio ships in three versions: Standard 5.0, Professional 5.0, and Technical 5.0. They share a common graphics engine, but target different communities of users. All three demonstrate strong Office 97 compatibility and support for VBA; the differences rest fundamentally in the collections of SmartShapes that ship with them:
The Standard version targets the typical business user and includes SmartShapes for flowcharts, organization charts, business process charts, marketing displays, and five other collections of shapes.
The Professional version adds shapes for Web site design and maintenance, network planning, and software design and modeling. The Professional version also ships with specialized wizards for such tasks as network diagramming, mapping databases into entity relationship diagrams, and creating databases from these diagrams. This version also includes a wizard for Web site mapping. Advanced developers will appreciate the support for the Microsoft Repository.
The Technical version aims to serve the needs of engineers, drafters, and facilities managers. This version ships with SmartShapes for mechanical engineering, process plant design, HVAC design, and space planning. It doesn't ship with all the wizards of the Professional edition, but comes with its own customized wizards for tasks such as AutoCAD conversion, building valves, generating electrical schematics, and area analysis.
This is the first in a two-part series on Visio Professional for Office developers. This installment introduces and demonstrates core Visio concepts and techniques, and highlights Office interoperability and comparability. The final section describes selected case study applications that target the needs of Office developers. The second installment will explore advanced Visio concepts and further examine Office interoperability as it introduces Visio's Object Model and demonstrates how to program it with VBA.
Getting Started with Visio
The Visio user interface can transform the diagramming and composition of simple business charts into a point-and-click affair; users just drag and drop individual SmartShapes from stencils onto a drawing page. It's a simple matter to connect the shapes with lines and arrows to represent a process; you never have to draw. Resizing and relocating shapes requires nothing more than a mouse movement or two. You can type text in an object simply by selecting the object and typing. Office users will feel right at home with the Formatting toolbar that lets them vary the font style, size, boldness, italics, underlining, and alignment of text within shapes.
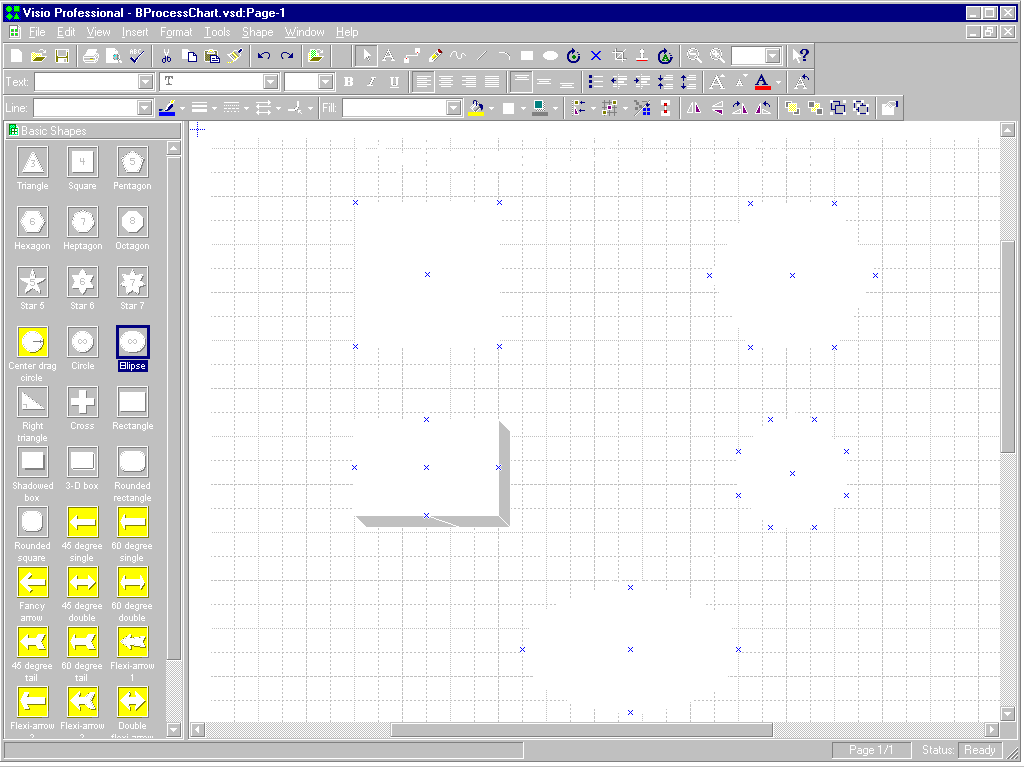
FIGURE 1 shows a process chart with two streams of work that converge on a single, final task. The Basic Shapes stencil to the left of the drawing shows the ellipse SmartShape, selected because it's the last element in the process. If you know how to draw in PowerPoint, you'll feel right at home in Visio. However, Visio is more powerful for diagramming tasks — especially if data connectivity or analysis is an issue. The SmartShape properties enable you to move process objects around the drawing page while the arrows stay in place. SmartShapes can retain their basic proportions as you resize them. This ability to control the behavior of Shapes is another way that Visio distinguishes itself from PowerPoint. Visio shapes understand that lines connect processes. This simple innovation expedites and simplifies the construction of business process charts.

FIGURE 1: A business process chart created with Visio.
When you start Visio, you can choose to open a template, i.e. a collection of one or more stencils and a drawing surface. Visio permits you to have multiple stencils open concurrently. After you open Visio, choose File | Stencils to add collections of SmartShapes. Choosing File | Stencils | Block Diagram | Blocks opens a Basic Shapes stencil (again, see FIGURE 1). If the stencil you want is open, but not showing, you can view its shapes by clicking its banner. Then, simply drag and drop the elements from the stencil to the drawing.
A significant aspect of Visio's attraction lies in the rich diversity of its stencil collections. FIGURE 2 shows a chart that compares Microsoft Office & Visual Basic for Applications Developer (MOD) to two fictitious computer publications. This diagram uses only two SmartShapes: the Feature Comparison and Feature On/Off shapes. Both of these shapes reside on the Charting Shapes stencil. The Feature Comparison shape prompts for the number of products and features in the table when you drop it onto a drawing page. You can then select its individual row and column labels to type product and feature names. The Feature On/Off shape makes it easy to mark MOD as the winner for each attribute.
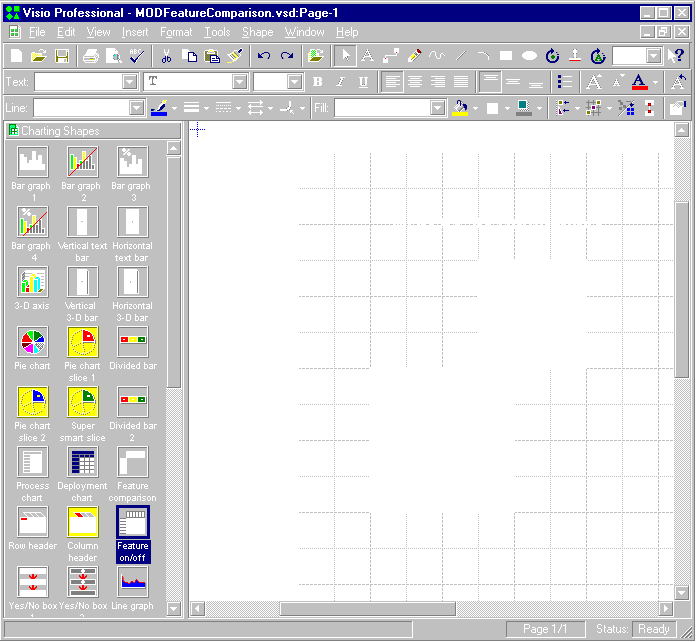
FIGURE 2: A marketing chart created with just two Visio SmartShapes.
There are many other stencils to support the varied applications of typical business users and professional developers. Visio also offers templates — collections of one or more stencils and a drawing page on which to position SmartShapes. Choosing File | New | Browse Templates opens a dialog box that provides a quick overview of the template collections along with previews of many of them. This dialog box groups the templates into categories. It also offers access to wizards that automate selected tasks, such as constructing an organizational chart. Other commands give immediate access to the templates and individual stencils. After you learn where your favorite stencils are, choose File | Stencils. It offers just the names of the SmartShape collections without a dialog box to access the wizards or preview the stencils.
Office Developers will especially appreciate the Win 95 and Office 97 User Interface templates, which provide many of the standard interfaces you'll use in your applications. They can speed communication with clients in the initial design phases of a project and can help with cost-estimating for a custom user interface. There are two sets of Entity Relationship Diagram SmartShapes, providing flexibility in graphically depicting tables, fields, and relations underlying your database applications. There's even a wizard for automatically converting your diagrams to an Access database. If there is a need to depict the detailed or overall logic flow behind selected elements in an application, or the overall application, there are several collections of SmartShapes to facilitate this objective.
ShapeSheets
Visio supports isomorphic relationships between the shapes in a drawing and their corresponding ShapeSheets. The process chart in FIGURE 1 contains five shape objects: a square, a 3D box, an ellipse, an octagon, and a hexagon. Users can graphically resize objects by dragging vertices or relocate them by dragging an object from its center to a new location. You can also perform these adjustments by varying values in the ShapeSheet for objects.
Open an object's ShapeSheet by selecting the shape and clicking Window | Show ShapeSheet. This opens a sheet with multiple sections. Office users will notice a basic similarity between this ShapeSheet and their spreadsheet in Excel. You can vary the properties of the selected shape by entering values and expressions in the ShapeSheet's cells. Shapes have multiple sections in their ShapeSheet. The individual entries in the sheets vary from one shape to the next. You can transform the square to a rectangle by independently altering either its width or height setting. Select the cell for either property and type a new value or expression in the formula bar. Then, click the green checkmark button to transfer the entry to the selected cell. The red "X" button clears the formula bar without updating the cell.
FIGURE 3 depicts the business process chart from FIGURE 1 with the square shape selected. The figure also reveals the square's underlying ShapeSheet. The formula bar contains an expression that will keep the shape's width in a constant proportion to its height. Because this ratio isn't one-to-one, the square will change into a rectangle. Clicking the green checkmark executes the transformation. After a designer clicks the checkmark any graphical resizing of the form causes the shape to maintain these new proportions.
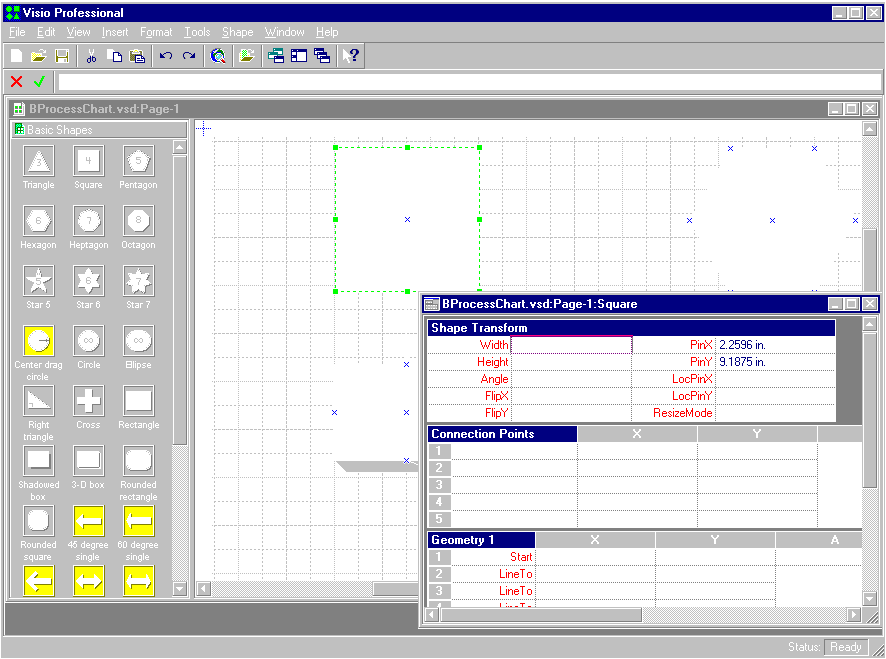
FIGURE 3: The ShapeSheet for the square in the business process chart from FIGURE 1.
FIGURE 3 also reveals three basic sections of the square's ShapeSheet. The example demonstrates that you can use the Shape Transform section to alter and monitor the basic proportions of a shape. The Pin locates the point in a shape about which it rotates and flips. Visio sets this, by default, to the shape's center. Designers can alter this pivot point for more granular control of a shape's behavior. The Transform section also denotes the x and y coordinates of the shape, relative to its parent on the drawing page (this can be the page itself). The Connection Points section gives the coordinates of points that you can use to connect one shape to another. The Geometry 1 section denotes the progression of vertices for a shape. Both the Connection Points and Geometry 1 sections will vary depending on the shape selected. The hexagon at the top right of the process diagram in FIGURE 1 has seven connection points — one for each vertex, plus the center. The ellipse at the bottom on the process chart has only five connection points, like the square.
After entering an expression in a cell, you can still graphically modify the formula. This graphical manipulation of an object can alter the shape in ways that you didn't intend. There are two ways to restrict graphical manipulation: First, the ShapeSheet contains a Protection section with 16 properties of a shape that you can lock from graphical manipulation in the drawing window. These cells contain either 0 or 1. The square shape in FIGURE 1 contains a 1 in its LockAspect cell, but other cells, such as LockWidth and LockHeight, contain 0. The 1 in LockAspect allows a designer in the drawing window to change the size without distorting the shape's defining square proportions. Altering the LockWidth and LockHeight cells to 1 places lock icons around the square's border in the drawing window. These locks signal the removal of the capability to resize the square (these icons show only when you select the shape). Second, the Guard function protects expressions from manipulation in the drawing window. Placing the expression:
Guard(TextWidth(theText) + .5 in)causes a shape's width to always be wide enough for the text it encompasses. The theText term designates the string in a shape, and the TextWidth function denotes the length of the string. The Guard function can change a protected shape by altering the value of other cells in the drawing window that indirectly impact it. Therefore, you may require several Guard functions to protect a single cell from change.
Visio supports a large array of functions to support the specification of shapes in a drawing. In addition to mathematical, geometric, and trigonometric functions, you can control the look of shapes with text, color, pattern, date, time, and logical functions. Many of the functions resemble those you know from Office applications. For example, the Now function returns the date and time for a system's regional settings. You can use it with the If function to color a shape representing a piece of equipment, depending on whether it was serviced within the past week, month, or year. The "immediate if" function, If, has the same syntax as in Excel:
If ( LogicalExpression, ValueIfTrue, ValueIfFalse )Other functions are idiosyncratic to Visio. The SetF function illustrates the kinds of results these functions can deliver. Its syntax takes one of three forms:
SETF( "cell", formula )
SETF( "cell", "formula" )
SETF( "cell", """formula""" )
The first syntax creates an expression that places a value in a ShapeSheet cell. SetF's second format writes a formula in a cell. The third way to write this function allows you to create an expression that evaluates to a string constant.
A related function, Evaltext, can compute a numerical outcome in a cell, based on the string entries in another cell for the same or a different shape. Recall that Excel uses a Value function for a comparable task.
Visio Wizards
Wizards are especially good to get to know when you first start working with a package. Often, you can develop a friendship with a feature set that lasts the entire time you use the product. The Visio Professional wizards are particularly intriguing for a couple of reasons: First, there are so many — 23 in all. Second, they perform so many tasks. The wizards help with Web work, database and software design, shape processing, and general business applications.
This introduction provides an overview of wizards, including what they do and how to use them. I arbitrarily divided the wizards into four groups. This segmentation serves as a basis for briefly summarizing each wizard and getting a general feel for the scope of services that the wizards bring to broad classes of activity. Because the individual wizards are accessible via a variety of different routes, the tables include the menu selections to reach them.
In 5.0 version 5.0, Visio offers a single wizard for Web work. This wizard does a good job of illustrating Visio's ability to add significant value to typical business chores. The Web Diagram Wizard navigates to an Internet or intranet site, and builds a diagram showing the hyperlinks between pages. Use this tool to create site maps for your own sites and others that you visit often. The links are live from within Visio, and you can save the diagram at your site as an image file and HTML page for quick linking to individual pages within a site. Launch the Web Diagram Wizard by choosing Tools | Macro | Internet Diagram | Web Diagram Wizard.
Software developers are likely to benefit most directly from the six wizards supporting database and software development (see FIGURE 4). Four of these work directly with ODBC data sources, such as Access, Microsoft SQL Server, and Oracle. When working with clients on sophisticated database designs, Visio can help by building entity relationship diagrams that map tables, fields, and their relations (see FIGURE 8 for a sample entity relationship diagram). This ability is particularly beneficial to Office developers since they can use the Create Database Wizard to automatically build a database based on the diagram. The Map Database Wizard performs the task in reverse, but this time you can work with any ODBC database source. Use this wizard to create an entity relationship diagram in Visio that reflects the structure of any existing ODBC data source. The Database Export and Database wizards allow you to build bridges between your other Visio diagrams and ODBC data sources. These wizards create live or static links between the ShapeSheet cells for a diagram and an ODBC data source.
| Wizard | Function | How to invoke |
| Create Database | Generates an Access 7 database from a Visio diagram. | Tools | Macro | Database | Create Database Wizard |
| Database Export | Generates a table in an ODBC data source that pulls its data from ShapeSheet cells. | Tools | Macro | Database | Database Export |
| Database | Generates an interactive link between the shapes in a Visio drawing, and the records and fields of an ODBC data source. | Tools | Macro | Database | Database Wizard |
| Map Database | Generates an entity relationship diagram based on any ODBC data source. | Tools | Macro | Database | Map Database Wizard |
| UML Export | Exports a UML static diagram from Visio to the Microsoft Repository. | Tools | Macro | Software Diagram | UML Export Wizard |
| UML Import | Imports a model as a UML diagram from the Microsoft Repository into Visio. | Tools | Macro | Software Diagram | UML Import Wizard |
FIGURE 4: Visio wizards for database and software development.
Advanced developers working with the Microsoft Repository can benefit from a pair of wizards that target interaction between Unified Modeling Language (UML) diagrams and the Microsoft Repository. UML lets developers create language-independent diagrams of software designs. The Microsoft Repository represents a way for a developer community to share common design information. One developer could insert a diagram representing an object model's hierarchical design. Other developers can reference this diagram in the Microsoft Repository as they prepare samples illustrating how to use the object model.
Another group of seven wizards helps you to work with Visio shapes (see FIGURE 5). Beginners are likely to benefit from Shape Explorer Wizard. The Stencil Report Wizard helps you document the master shapes on a stencil. This wizard will do a search of the stencils to find a master shape. These stencil master shapes act as classes or templates for the generation of shapes in a drawing. The most efficient way to assemble drawings is to drag and drop master shapes onto a drawing surface (you can also compose a drawing from graphic primitives: lines, ovals, etc.).
| Wizard | Function | How to invoke |
| Build Region | Groups a selection of geographic areas represented by shapes into a group designating a region. | Tools | Macros | Maps | Build Region |
| Custom Properties Editor | Add or delete fields from the custom property section of a ShapeSheet. This wizard also edits master shapes on stencils. | Tools | Macro | Custom Properties Editor |
| Page Layout Editor | Automates designating page properties; use for properties such as orientation and scale. | Tools | Macro | Visio Extras | Page Layout Editor |
| Print ShapeSheet | Lets you print ShapeSheet sections to printer, file, or Windows Clipboard. | Tools | Macro | Visio Extras | Print ShapeSheet |
| Shape Explorer | Search multiple stencils for a shape. | Tools | Macro | Shape Explorer |
| SmartShape | Customizes the appearance or behavior of a SmartShape. | Tools | Macro | Visio Extras | SmartShape Wizard |
| Stencil Report | Creates a drawing of the masters on a stencil. | Tools | Macro | Visio Extras | Stencil Report Wizard |
FIGURE 5: Visio wizards for shape processing.
If you want to prepare a hard-copy report documenting a drawing's shapes, the Print ShapeSheet Wizard will come to your aid. Use the Custom Properties Editor to modify your shape settings if the printout indicates the need for refinement. The SmartShape Wizard lets you further customize the appearance and behavior of your SmartShapes in a drawing. If you are drawing to a special scale, the Page Layout Editor can help. Those using the geographic shapes (yes, Visio includes a healthy selection of maps) will find special value in the Build Region Wizard — it lets you define ad hoc regions based on collections of shapes.
Another collection of nine wizards performs a grab bag of miscellaneous business chores (see FIGURE 6). These specialized wizards tackle specific business tasks. If you have responsibilities in one of these areas, the wizards can make life good. Computer professionals charged with managing a company network, for example, can tap two Visio wizards to diagram their network and maintain it in an Access database. Developer team managers may find the Project Timeline Wizard good for drawing charts that illustrate the duration of, and linking among, tasks. Visio users can base these charts on Microsoft Project or Excel files.
| Wizard | Brief Function | How to invoke |
| Chart Shape | Create special stackable and extendable shapes for data charts. | Tools | Macro | Business Diagram | Chart Shape Wizard |
| Flowchart Database | Links a drawing to a database so that changes to shapes update an Access database. | Tools | Macro | Flowchart | Flowchart Database Wizard |
| Flowchart-TQM Diagram | Creates specialized flowchart types. Can also create flowcharts from text or Excel files. | Tools | Macro | Flowchart | Flowchart-TQM Diagram Wizard |
| Network Database | Generates an Access 7 database based on a network diagram. | Tools | Macro | Network Diagram | Network Database Wizard |
| Network Diagram | Automates drawing of a network based on segment and node information about a network from an ODBC data source. | Tools | Macro | Network Diagram | Network Diagram Wizard |
| Office Layout | Draws an Office layout. | Tools | Macro | Business Diagram | Office Layout Wizard |
| Organization Chart | Creates an organization chart based on entries in a text, Excel, or ODBC data source file. | Tools | Macro | Business Diagram | Organization Chart Wizard |
| Project Timeline | Creates a project's timeline chart based on an Excel, text, or Project file. | Tools | Macro | Business Diagram | Project Timeline Wizard |
| Property Reporting | Creates inventory or summary reports for the shapes in a drawing. | Tools | Property Report |
FIGURE 6: Visio wizards for miscellaneous business chores.
General business users may find their favorite wizards among the remaining ones. The Organization Chart Wizard creates an organization chart based on an ODBC data source. This keeps the organization data where it belongs (in a database) while making it easy for you to view it graphically whenever necessary. The Office Layout Wizard is handy for assigning spaces and furniture in an office area. Hooking this tool to the Property Reporting Wizard lets you create an inventory of the furniture in an area. Computer professionals can also apply this Property Reporting Wizard for creating summaries and inventories of the computer equipment in their networks. Visio comes to the aid of those who graph data with one of its templates, but the Chart Shape Wizard adds even more firepower for this task. Use it to create custom stackable and extendable shapes for your charts. A pair of wizards simplifies flowcharting tasks. The Flowchart Database Wizard lets you link a drawing with a table in an Access database. Because the link is live, modifications to your chart can update the database and vice versa. The Flowchart-TQM Diagram Wizard creates a cause-and-effect, top-down, or cross-functional diagram in a flowchart format. These diagrams link to text or Excel files.
Selected Case Study Applications
This section briefly describes three case study applications that give you a hands-on feel for making Visio work. I'll start with a Web sample because that is such a popular topic. The second sample describes how to map and create databases in coordination with Visio diagrams. The final sample illustrates a potential application of two stencils that target the needs of Office developers.
FIGURE 7 shows the outcome of running the Web Diagram Wizard against a small Web site (http://www.dobson.win.net/copy_of_cab233/) with just 5 pages. The wizard completely prepared the site map — opening the site and running through each page to prepare the map. And the hyperlinks work from within Visio. To open a page, right-click anywhere in the box representing a page and choose Hyperlink. Then, select either Open or Open in New Window. You can return to Visio from the Web page by clicking Back, or pressing AF.
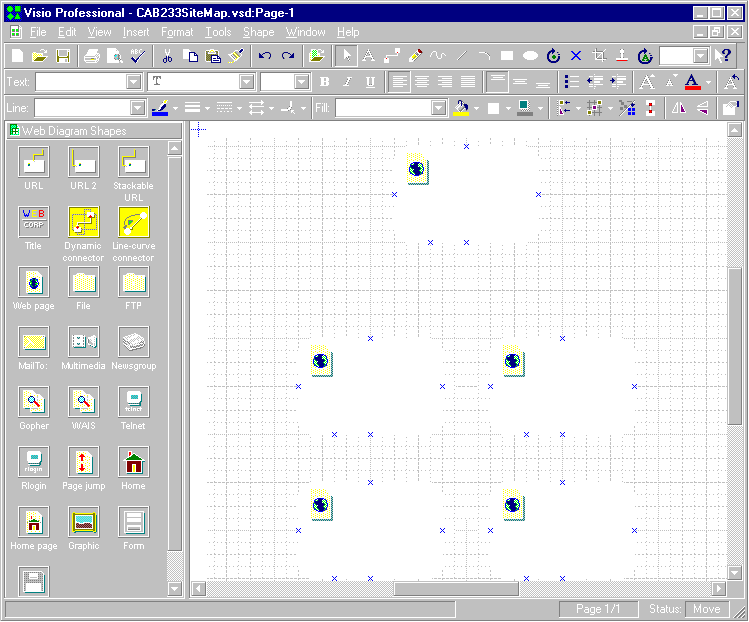
FIGURE 7: A Web site map created with the Web Diagram Wizard.
This site map is great, but you need it more at your site than in Visio. The File | Save As command automatically generates two files to facilitate this goal. You must choose HTM as the file type. Send both files (an .htm and an image file, such as a .gif file) to your Web site. This creates a Web page with the site map at your site. Click the link address on any card to jump to the corresponding Web page. You can even use the Web Diagram Wizard with the File | Save As command to generate site maps for other sites. This can serve as a courtesy for your site visitors as well as a quick way for you to pick where to jump into the structure of another Web site.
This site map capability is ideal for Office developers doing Web work. Those of you doing Web work are probably astonished at how fast and easy Office prepares Web pages. Furthermore, there is normally a huge amount of content in Office format available for transfer to the Web. However, there is no good tool for creating site maps based on Office content. With Visio, now there is.
Overall, the Web Diagram Wizard is easy and fast. It wasn't too hard to find minor flaws, however. First, it's easy to generate a site map that has an absurd amount of detail. You can limit the amount of information in the site map, but this requires you to read the wizard screens and make the right choices. I like the flexibility to tailor the detail in a site map, but I wish it made better initial choices about what to include for most uses. Second, you have to click on the Web address in the card for a Web page to make the link work. Clicking off the address in the card has no effect. Third, it would be nice if the wizard gave you more choice in the layout and design of the card representing the Web pages. Fourth, the wizard is not so smart about creating maps for sites with framed pages. I found it easy to generate a faulty map with this kind of welcome page for a site.
FIGURE 8 shows an entity relationship diagram of the classic Pubs database that ships with Microsoft SQL Server. It shows all the tables with their fields. In addition, it indicates which tables relate to one another. Reading the foreign key (FK) fields shows you how tables relate to one another. Visio automated the preparation of the diagram with its Map Database Wizard. This feature works for any ODBC database source. Therefore, you can use it equally well for your Oracle and Access databases.
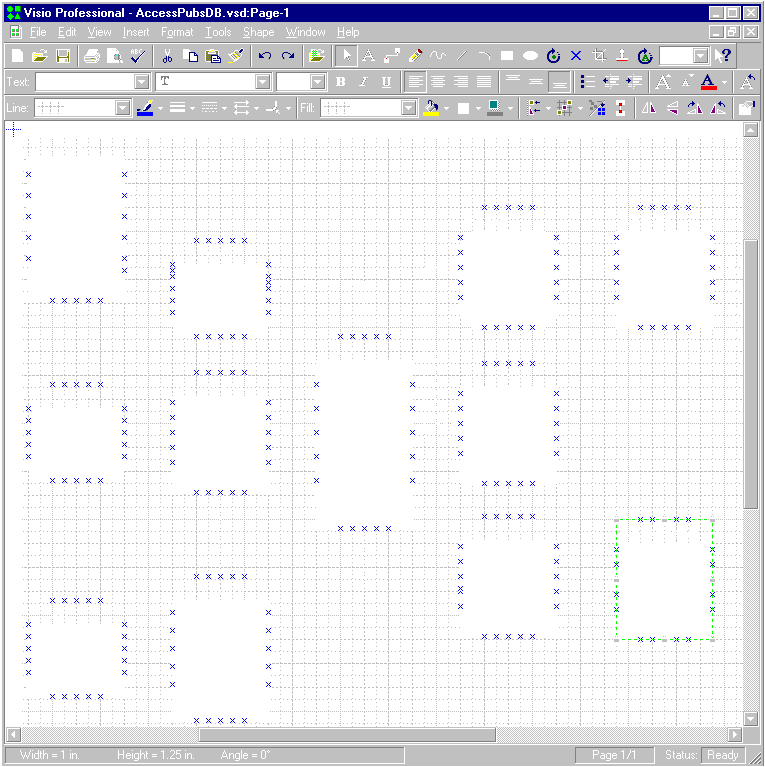
FIGURE 8: An entity relationship diagram of the SQL Server Pubs database. Visio offers wizards for automating the creation of these diagrams, and creating Access databases based on them.
Once you get a database design in Visio, you can alter it by adding and dropping tables and fields. The same holds true for relationships between tables. Many folks will find it more flexible and meaningful to work with the graphic representation of the database than the database interface. This kind of diagram is convenient for doing a technical review of the database design, as well as getting an approval of the final design. In fact, you can readily add a signature approval line to the diagram.
As an Office developer, I often want to work with the Pubs database in Access. I don't mean simply link to the Pubs database; I want the whole database in Access. But this has always been more work than the benefits justified. Visio's Create Database Wizard made the task trivial. This is because Visio automatically created an Access 7 database based on the diagram in FIGURE 8. Then, I only needed to append the records to the Access tables from their Microsoft SQL Server siblings.
Modeling a database diagrammatically, and prototyping its development in a rapid application development environment like Access, can dramatically lower the cost of database design and development. The approach would be even more useful if Visio let you create the Microsoft SQL Server tables after you finish prototyping your design in Access. This is something we can hope for in the next release of Visio. In the meantime, Office developers can use the Access Upsizing Wizard (a utility available free from Microsoft).
Office developers may be attracted to the Win 95 User Interface and the Office 97 User Interface stencils in Visio. In the same way entity relationship diagrams help you map a database design, these stencils help you picture a user interface design. FIGURE 9 shows a sample form with four tabs on it. Two tabs are not on the tab stack for easy viewing. Notice (to the left of the diagram) the rich array of standard user interface options from which developers and their clients choose. Clients with limited programming ability can illustrate a look for their applications. By diagramming the relationship between forms, you are able to convey the feel of a custom system. Developers may use these two stencils to get a correct view of the user interface without writing a single line of code.
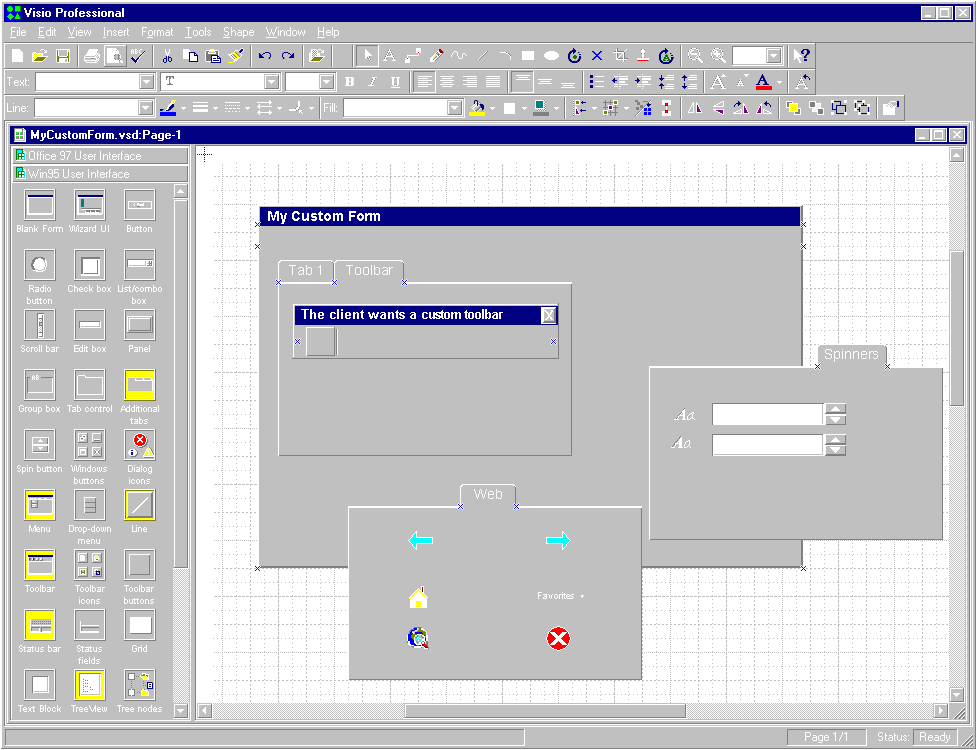
FIGURE 9: A sample diagram illustrating the capability to specify a custom Windows interface with Visio.
Using the Property Reporting Wizard, a developer has the ability to readily prepare an inventory or summary of all the controls in the user interface design. This kind of input is useful in preparing and justifying the cost estimate to perform a project. Figure 10 shows a sample that appears on the Visio diagram. It also includes a reference to the Excel workbook file that a developer would use for preparing a cost estimate. As you might expect, the Property Reporting Wizard lets you create the Excel workbook on-the-fly. This kind of report is useful for all kinds of tasks, including office-space planning, network design, and most engineering projects.
Figure 10: A bill-of-material report style for the interface design elements in FIGURE 9.
Conclusion
Visio can draw, but it's more than a drawing package. Its SmartShapes can communicate with ODBC data sources, including Microsoft SQL Server, Oracle, and Access. It also writes and reads data directly from Excel workbook files, and reads Web sites and prepares site maps.
Visio is ideal for Office developers because its look-and-feel mimics Office in so many details. Beyond that, it interacts with Access and Excel through many of its wizards and SmartShapes. The drawing functionality in Visio complements the presentation-style drawing available through PowerPoint. Its built-in SmartShapes are tailored for many application areas that Office developers may encounter, including space planning, network design, data charting, organization chart preparation, Web site mapping, and flowcharting. The Win 95 and Office 97 UI SmartShapes fit the needs of Office developers seeking to interact quickly with clients on the design of a custom project's interface.
Visio isn't a new company. It has a history of successfully shadowing Microsoft innovations. This record of accomplishment will reward your learning effort with enhanced compatibility over time and expanded markets. The diversity of applications that Visio serves is already impressive, and it's likely to grow in the future. Its Office and VBA compatibility will enhance your opportunity to serve these markets as well.
Rick Dobson, Ph.D., is president of CAB, Inc., a database, Office, and Web consultancy. His byline appears in many publications, including Byte, NetGuide, and Visual Basic Developer. He is also a contributing editor to Microsoft Interactive Developer. You can reach him at RickD@cabinc.win.net.