This article may contain URLs that were valid when originally published, but now link to sites or pages that no longer exist. To maintain the flow of the article, we've left these URLs in the text, but disabled the links.


MIND

Beyond the Browser

beyond@microsoft.com

Ken Spencer

Debugging with Visual InterDev 6.0
V
isual Studio® 6.0 includes a built-in feature that allows you to debug applications and components built with Visual InterDev and Visual J++®. You can also use the debugger to step into the code of components used in Visual InterDev applications, but written in languages like Visual Basic® and Visual C++®, as long as you have the source code. The Visual InterDev debugging features also allow you to single-step through ASP, Scripting Object Model, and client code. You can set breakpoints to stop execution, inspect the contents of variables, reset variables, and work with the internals of your application while it is running. These features allow you to find logic and other errors in your code and repair them quickly.
      You can debug applications running on a developer's workstation, assuming they are running Windows NT® Server with Microsoft Internet Information Server (IIS) 4.0 or Windows NT 4.0 Workstation with Personal Web Server (PWS). This is known as local hosting, since the application is running on the user's local system. Visual InterDev also lets developers debug client scripts on their workstation using a local copy of PWS in Windows 95 or Windows 98. This configuration does not support debugging of server script in ASP pages; this is supported only on Windows NT.
      Developers can also attach to and debug server scripts running in ASP pages on a remote installation of IIS. This lets you issue debugging commands across the network, but it is limited in that only one user at a time can use remote debugging on a server.
      Debugging an ASP application requires that the user performing the operation have a valid Administrator account and password on the IIS server. This requirement alone is enough to make you rethink how you will use the debug feature against production and development servers. Since only one user at a time can debug an application, it can create a bottleneck for teams developing apps on one server.
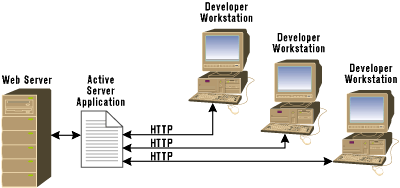
      Instead of debugging against a development or production server, developers can use the Visual InterDev 6.0 Local mode to build, test, and debug portions of the application in isolation from the rest of the team. Figure 1 shows a typical configuration. Each developer is running Visual InterDev on a workstation, hosted by Windows NT 4.0 (Workstation or Server). In addition, each developer's system is using either PWS or IIS for local Web hosting services, as recommended. This configuration lets developers debug applications, but restricts their access to the Administrator password to their own workstation. It also offers optimal performance since the application will only slow down the user's own development system.
Figure 1: Local/Master Debugging Configuration
      Figure 1: Local/Master Debugging Configuration

      The configuration shown in Figure 1 allows users to employ the Local/Master mode to debug and manage applications. When the developer needs to debug an application running on the development server, they switch the application to Local mode. A complete copy of the site is replicated to a local Web server running on the developer's machine. In Local mode, the app is debugged and changes are saved on the developer's machine in isolation from the rest of the team. When they are ready to update the server, they switch back to Master mode and the changes are synchronized with the master copy.
      The basic system components required for debugging ASP code with Visual InterDev 6.0 are:
  • Microsoft Windows NT 4.0 Server or Windows NT 4.0 Workstation
  • IIS 4.0 or PWS 4.0
  • Visual InterDev 6.0 Server components
  • Remote Machine Debugging for IIS
  • Windows NT Service Pack 3 or 4
      You'll also need the IIS hotfix shipped with Visual InterDev 6.0 or Windows NT 4.0 Service Pack 4.
      Service Pack 4 contains a large number of bug fixes for IIS, but it was not available until after Visual Studio 6.0 shipped. A small number of these bugs are debugging-specific. To remedy the situation until Service Pack 4 was released, the IIS group released a patch that contains the fixes needed for debugging. The patch changes only one file, asp.dll, and will not change its version number so all other setups, including Service Pack 4, will update it correctly later. Windows NT 4.0 Service Pack 4 includes the patch, so you do not need to install both updates.
      If any of this software is not installed, then debugging will not work correctly.

Proper Installation

      The first step in properly configuring Visual InterDev for debugging goes back to installing it on the server or workstation. If you are using the suggested configuration described earlier, then a developer workstation can serve as both client and server.
      The most frequent problem people have using the debugging features involves configuring the server correctly. If the server is not configured properly, you will spend many frustrating hours trying to debug applications to no avail. A few minutes spent on configuration can save you a tremendous amount of time. Before trying to reconfigure a system to use the debugger or installing the Visual InterDev software, you should download the debugging whitepaper and files found at http://msdn.microsoft.com/workshop/languages/vinterdev/bin/Debug/DEBUG4.asp. Sample debugging files here include a couple of registry scripts, a client test page, and a utility named viddbg.exe.
      Viddbg.exe is a handy little program that shows you the configuration of a system in relation to its ability to support debugging. If you have already installed Visual InterDev, then before you reinstall or configure anything, you should download the debugging files and run this program. It will inspect your system and give you a snapshot of its status. This will save you lots of time in deciding what to install or configure.
      To use this tool, copy it to your file system and execute it from the command prompt, using one of three command line options. The /server option reports on the accounts that have DCOM permissions set up (and thus the ability to remotely debug the machine), the script and Java language options for the machine, the asp.dll version, and whether the files used by Visual InterDev for automatically enabling server debugging exist on the machine. The /client option reports on the script and Java language options for the machine and the location of the management console and Internet Service Manager files needed to enable debugging on a remote machine. The /ver option lists all of the debugging-related files and the version numbers of each. I usually run this program with the /server or /client option and route the output to a file like this:

 viddbg /server > serverconfig.txt
      When you run viddbg.exe with the /server option and the server applications are not set up correctly, you might see output similar to Figure 2. There are several interesting things about this output. In the DCOM permissions section, the following two items are shown with the permissions status Using Default Permissions:
 Catalog Class Launch permission list
 Catalog Class Access permission list
This means they use the default DCOM permissions. This is not the correct permission for the Catalog class to use with remote debugging.
      The section starting with the header ASP.DLL Version Information shows the version information for the ASP processor. The first part shows you the version of the asp.dll installed. This is the component that was updated with the asp2fix1.exe patch or Windows NT 4.0 Service Pack 4. You can tell that the patch has been applied to this system successfully by checking the version number and size for the installed asp.dll—they should be the same as the required DLL.
      The real problem for this particular system is shown in the VID Server Components section of the output. Notice that both entries under this heading show an error. This results in the last line of the output that states: "***VID Server Components are not installed correctly.***"
      How do you fix this? The first step is to set up Visual InterDev correctly. This involves installing the Visual InterDev server components on the system that will perform the debugging operation. The following steps can be used to install the Visual InterDev server components. These steps work if you already have the Visual InterDev client installed and just need the server components.
  1. Insert the first Visual InterDev or Visual Studio CD.
  2. Setup.exe automatically runs the installation wizard, which will step you through the installation process. If Setup.exe does not start automatically, you can always start it manually.
  3. Select Server Applications and Tools (Add Only), then click Next.
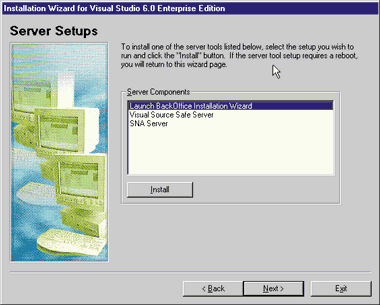
  4. Select Launch BackOffice® Installation Wizard, then click the Install button (see Figure 3).
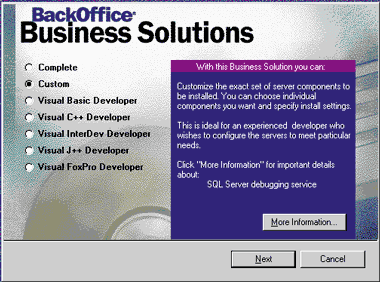
  5. The BackOffice installation wizard will prompt you to select the installation method. Select Custom and click Next (see Figure 4).
  6. Verify that your disk contains enough space, then click Next.
  7. Select the Remote Debugging Machine and Visual InterDev Server options.
      Complete the installation steps by clicking Next at each step until the wizard completes. This will install the necessary server components for debugging. Don't forget to install either Windows NT 4.0 Service Pack 4 or the ASP hotfix! At this point, your system can be used for local debugging.
Figure 3: Running BackOffice Installation Wizard
      Figure 3: Running BackOffice Installation Wizard

      Once you have installed the hotfix, you should be ready to debug applications running on the system on which you installed the server updates. If this system is running IIS, you can debug locally if Visual InterDev is installed on the server, but remote developers cannot debug on this system. This is because the DCOM permissions required for debugging are not yet set correctly. If the system is a workstation running Windows NT 4.0 (Server or Workstation), then you can debug applications that are hosted by the Web server locally or running in Local mode.
Figure 4: Custom Installation Option
      Figure 4: Custom Installation Option

      If you are installing Visual InterDev for the first time on a system, you need to take a couple of additional steps. These are similar to those in the previous list, but they include installing the Windows NT Option Pack and its related components:
  1. Insert the first Visual InterDev or Visual Studio CD.
  2. Setup.exe automatically runs the installation wizard, which will step you through the installation process.
  3. When the client setup completes, the installation wizard will give you the option to perform the server setup. Select Launch BackOffice Installation Wizard, then click the Install button (see Figure 3).
  4. The BackOffice installation wizard will prompt you to select the installation method. Select Custom and click Next.
  5. Verify that your disk contains enough space, then click Next.
  6. Select at least the Remote Debugging Machine, Visual InterDev Server, Front Page Server Extensions, and MS Data Access Components options from the top level of the components list.
  7. Expand the Windows NT Option Pack node and select the following: Internet Information Server, Microsoft Management Console, Windows NT Option Pack Common Files, and Microsoft Transaction Server. Select the Visual InterDev RAD Remote Deployment Support node. Then expand the Visual InterDev RAD Remote Deployment Support node and select the second instance of Visual InterDev RAD Remote Deployment Support to select this entry at two levels in the outline.
  8. Complete the installation and reboot when prompted.
      After rebooting, don't forget the ASP hotfix! At this point, your system can be used for local debugging.
      Note: if the Windows NT Option Pack is reinstalled on a system after you have configured the debugging options, the Remote Machine Debugging component must also be reinstalled.
      Now you can configure the system for remote debugging to allow other developers to remotely debug apps. This step involves configuring DCOM permissions for the users who will debug remotely. The permissions can be set using the DCOM Configuration Manager utility. You must be logged on as an Administrator to make these changes. The steps are:
  1. Run User Manager for Domains.
  2. Add the user's Windows NT account to the Administrators group.
  3. Click Run from the Start menu.
  4. Enter "dcomcnfg" and click OK. This starts the DCOM Configuration Manager.
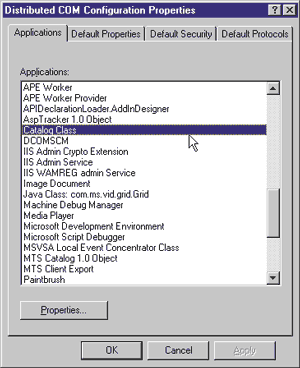
  5. On the Applications tab, scroll to the Catalog Class entry (see Figure 5), then click the Properties button.
  6. Click the Security tab.
  7. Select "Use custom access permissions," then click Edit.
  8. This launches the standard Windows NT Add/Remove users' dialog box. The simplest way to add permissions is to add the Administrators group because in steps 1 and 2 you added all of the users that you want to remote debug into this group.
  9. Click OK when you are finished making changes.
  10. Repeat steps 8 and 9 for the "Use custom launch permissions" option.
  11. Click OK to close the Catalog Class Properties dialog box.
  12. Select the Machine Debugger Manager from the Applications tab listbox, then click the Properties button.
  13. Scroll down in the list of applications until you find the Machine Debug Manager.
  14. Click Properties to open its properties.
  15. Repeat steps 7 through 10.
  16. Click OK to close dcomcnfg.
  17. Reboot the machine.
Figure 5: Selecting Catalog Class Options
      Figure 5: Selecting Catalog Class Options

      When the machine restarts, the new users will have permission to debug. By default, the user who is logged on when the Remote Machine Debugging Server Setup runs will be given permission to debug the server on that machine. Anyone other than this user must be added using the preceding steps.

Conclusion

      Now you should be able to debug your applications locally or remotely. If you have any problems, review the setup and troubleshooting sections of the debugging whitepaper mentioned at the beginning of this column. I have successfully used the steps outlined in this column on a number of systems.
      You should also be aware that the debugging operation sets the IIS application to an out-of-process state. This makes the application run in its own process space, resulting in a huge performance hit. If you set the launch permissions for the project in Visual InterDev to automatically allow debugging (on the project properties page), Visual InterDev will automatically switch the application to an out-of-process state and back during the debug cycle. This results in the application performing optimally except when debugging is currently in process. This process can fail if Visual InterDev crashes when a debug cycle is in progress.
      The failure to reset the application to an in-process state occurs because Visual InterDev dies before it can set it back. In this case, you can use the IIS Internet Service Manager to uncheck the debug boxes and set the application back to normal.

Site Builder Network
http://msdn.microsoft.com/workshop/server/components/daciisperf.asp

From the February 1999 issue of Microsoft Internet Developer.