![]()
|
This article may contain URLs that were valid when originally published, but now link to sites or pages that no longer exist. To maintain the flow of the article, we've left these URLs in the text, but disabled the links.
|

| Ken Spencer |
| Graphing on the Web |
Creating graphs for the Web is another matter. Most of the time, you can't rely on all of your users to adopt Microsoft® Internet Explorer as their browser, so you can't depend upon ActiveX support in the client. This means you need server components that generate the graphs in a format that can be read by any browser. In this column, I will demonstrate how to use Pinnacle's Graphics Server and its new Internet features to build a graphing application. Graphics Server is an in-process COM component that runs on the Web server. Your ASP code simply interacts with the component to set its properties and execute its methods. The component creates the graph and either sends it to the client as an image or feeds it to an ActiveX control that runs in the browser. This flexibility allows the application designer to build the app to suit their target browser and tailor the features accordingly. Starting Out A demo of Graphics Server was recently distributed on the Microsoft Web Solutions CD. You can also find out more about Graphics Server at http://www.graphicsserver.com. Follow the directions included with Graphics Server to install it. Once you have installed Graphics Server, open Visual InterDev™ and create a new project. When your new project is up, you need to add the Graphics Server design-time control to the Toolbox. Right-click the Toolbox, then select Customize. Check the box for the Pinnacle-BPS Graph Designer entry, then click OK. You should see a new entry entitled Graph on the Toolbox. Make sure you have an Images directory under any directory where you place an ASP file that uses the Graph component. The Graph component uses this Images directory as temporary image storage. The readme file shipped with Graphics Server contains information on how to set the permissions for this directory. Now you should be ready to build your first application. The first thing you'll create is a simple 3D bar graph. The data to drive the graph will come from the Northwind sample database that ships with SQL Server™ and Microsoft Access. First, create a new ASP file (the sample is called SalesChart1.asp). Then, add a new Data Command and name it OrderTotalsByMonth. Next, add the SQL for the command: |
|
| This statement pulls order data from the Orders and Order Details tables. The Quantity column is summed for each month's shipments. Finally, the data is ordered by the ship date to sequence the data into month order. The statement contains a reference to built-in SQL functions to extract the month and year parts of the date: |
|
| This allows data manipulation to be completed by SQL Server, and your code doesn't need to manipulate the recordset to summarize or order the data. The Having clause simply makes sure that the dates selected contain a value, eliminating any orders that have not shipped, and selects the date based upon the year the user selects.
Once you have renamed the Data Command and entered the SQL, click the Parameters tab and enter a parameter name (such as YearSelected). Click OK to close the command's properties. The graph will display the quantity of items shipped each month. To create the graph, the user needs to select which year to graph. To implement this, add a Listbox design-time control to the page. Also add the PageObject design-time control to the page just before the page's </BODY> tag. Now add the following code to your page in the header section: |
|
| You're ready to work on the graph. The Graph design-time control will insert a block of VBScript code into your page. This code does all the work of creating and displaying the graph. You can place the Graph design-time control inline in the page or you can drive it from a subroutine, which is the approach I took.
To build the graphing subroutine, create a server-side script block and add the following code: |
|
| This code creates a subroutine and adds an HTML table to align the graph on the page. Next, drag the Graph design-time control from the Toolbox and drop it between the <DIV> tags. This should result in a dummy graph image inside the design-time control. Whenever you need to display the graph, your code can call the Draw3dGraph subroutine, which will execute the graphing code. This comes in handy when you need to control the graph programmatically.
Next, you should set the properties for the graph. Right-click the Graph design-time control, then select Properties from the shortcut menu. When the property dialog is displayed, click the Custom Pages button. The properties you set in the design-time control will be added to the script in the page, and will determine how the control operates. For this example, you're going to change just a few settings. |
 |
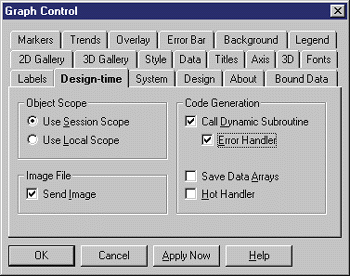
| Figure 1: Code Creation Settings |
First, click the Design-time tab (see Figure 1). These settings control the code generated by the design-time control. Check the Call Dynamic Subroutine checkbox. This generates code that will execute the Graph1_SetDynamic subroutine. You will create this subroutine to load the graph with data, giving you complete control over how the data is loaded. You can load the data directly into the design-time control, but this makes the data static and does not let you change it at runtime. Next, check the Error Handler checkbox. This generates error-handling code, trapping errors that occur if the Graph1_SetDynamic subroutine is missing.
To select the type of Graph, click the 3D Gallery tab, then click on the graph type you want to use. For this sample, select the bar graph.
When you have completed these changes, click OK, then click OK again to close the property pages. This completes the basic configuration of the graph. You can drag the handles on the design-time control to set the graph's width and height to your exact specifications.
Now let's add a recordset to populate the listbox with the years in the Orders table. Drag a Recordset design-time control from the Toolbox and drop it on the page. Set the SQL property to:
|
| Open the properties for the listbox and bind it to the recordset. Bind both the Value and List properties of the listbox to the ShippingYears field in the recordset.
Next, open the Script Outline and add an event handler for the listbox's onchange event and the PageObject's onenter event. The code for the listbox's onchange event is: |
|
| This code sets the YearSelected variable and opens the recordset. The code for the PageObject's onenter event is: |
|
| This completes the first page. You can now view it in the browser and test it. Your page should display a graph with random test data, and the listbox should be populated with the available years from the Orders table.
Linking the Data You can now add the code to load the graph. The Graph component will call the Graph1_SetDynamic subroutine before the graph is created, so you can change or set almost any of the graph's properties here. In this example, the code is simple and does not require many settings. First, add the subroutine header: |
|
| Next, define a variable as a counter to load the graph data: |
|
| The easiest way to determine the number of points you're working with is to obtaining the value from the recordset. The next statement checks for either zero records or a blank selection by the user. If either condition is true, then the graph's height is set to 0, forcing it to display only a thin line on the page: |
|
| The following statement sets the NumPoints property of the graph to the number of records in the recordset: |
|
| The following two statements write the number of points to the outgoing HTML and initialize the counter: |
|
| At this point you can loop through the recordset and load the graph: |
|
| The Data property of the Graph object directly sets the internal Data array with a data point. The iPointerCounter is an index into this array. In this example, iPointerCounter is incremented while there are more data points in the rsSales recordset. The Label property works almost exactly like the Data property, except Label sets the value for each label. Using the same index (iPointerCounter) allows this application to synchronize the labels for each data point. In this example, the label will be set to 1 for January, 2 for February, and so on. If the data does not contain information for a particular month, this code still works because you can extract the month from the Label property. |
 |
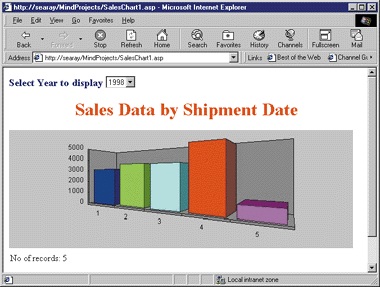
| Figure 2: Dynamically Generated Graph |
The resulting page is shown in Figure 2. Users cannot interact with this graph. In fact, they can't do anything with the page other than save the image. However, you can expand the ASP code to turn this into a hot graph with which users can interact.
Drilling Down
Graphs and tables of data are typically used to perform drill-down analysis on some type of data. For instance, in the sample it would be nice to click on a bar in the graph and drill down into the details for a particular month. You can accomplish this by changing a few settings in the Graph design-time control, then adding a bit of code to link the graph to the drill-down data. For this example, let's copy SalesChart1.asp to SalesChart2.asp and modify it to provide drill-down functionality.
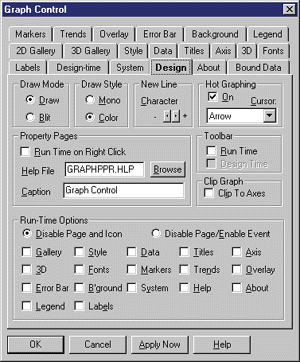
The first step requires a modification to the graph settings. First, open SalesChart2.asp in the Visual InterDev editor. Next, open the properties for the Graph design-time control and click the Design-time tab. Check the Hot Handler checkbox (see Figure 1). Next, click the Design tab and check the Hot Graphing On checkbox (see Figure 3). These two settings enable the hot graph features and cause the design-time control to write the required VBScript code to handle the image map. When you complete these changes, click OK to close the properties.
 |
| Figure 3: Turning Hot Graphing On |
Add the following line as the first command under the If YearSelected > "" statement in the lstYears_onchange event:
session("YearSelected") = YearSelected| This code creates a new session variable to hold the year selected by the user. This will be used each time the user revisits SalesChart2.asp for any reason.
Next, add the following code after checking the session name in the thisPage_onenter event: |
| This code resets the year from the session variable created earlier, then retrieves the HitPoint variable from the query string. If HitPoint is set, this indicates that the user has clicked a bar in the graph. HitPoint shows which bar the user clicked.
If HitPoint is set, the month the user selected is pulled from a session variable with this statement: The last line in the If statement block redirects the user to the SalesChartMonthDetail.asp page, which contains another graph to display the detailed data. The year and month the user selected are passed as query string variables on the URL. The other changes occur in the Graph1_SetDynamic subroutine. Here you dimension a new variable to hold the labels (months) for later retrieval: |
Next, add the following statement just before or after you set the Graph.label property in the loop:
|
| The statement you see above sets a session variable to the LabelText array for later use.
Now, when the user clicks a bar in the graph, they will be redirected to SalesChartMonthDetail.asp. This page needs the code to display the detail data to the user. I used a tape graph created in the same manner as the one on this page. When the user clicks a bar, they see the details for the bar displayed in another graph. You can also link to a grid or any other type of display you might need. When the user clicks on a hot graph, the Graph control also passes the name of the graph and the number of the dataset as QueryString variables. This information is especially useful when you are dealing with more than one graph or dataset. The details of SalesChartMonthDetail.asp are not shown here, but are included in the sample files available for download at the top of this page. Wrap-up You can change almost any setting of the Graph component programmatically. In fact, if you display the runtime text for the Graph component, you will see an example of how it works with the various properties and methods. It's useful to review the code it generates each time you make a change with the design-time control. If you sit down and take the time to understand how the code works, you can really work magic with it. In fact, you can use the Graph control without the design-time control—but then you must set all its properties in your code. |
From the May 1999 issue of Microsoft Internet Developer.