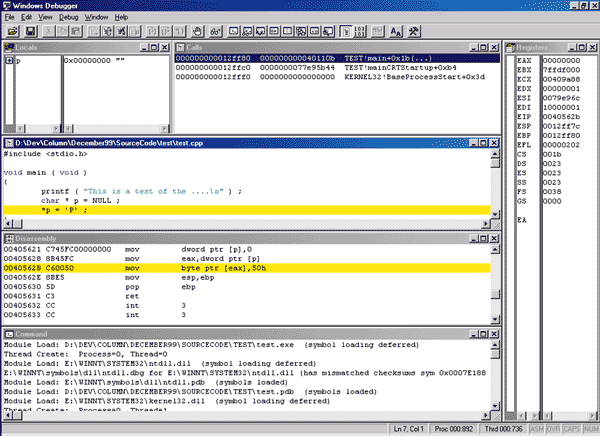
Figure 1 Debugging with WinDBG
 |
Figure 2 Common WinDBG Regular Commands
|
Command |
Name |
Description |
|
? |
Evaluate Expression |
Evaluates and displays the value of the expression or symbol in the context of the current thread and process. |
|
G |
Go |
Continues execution for the given process or thread. You can modify the Go command to break at a specific line or address when the specified thread executes at that address. |
|
GH |
Go - Exception Handled |
Marks the specified thread's exception as handled and continues the thread from the address that caused the exception. |
|
GN |
Go - Exception Not Handled |
Continues execution of the specified thread without marking the exception as having been handled. This allows the program's exception handler to handle the exception. |
|
K |
Display Stack Trace |
Displays the call stack of the specified thread. Modifiers: B displays the first three parameters N displays the stack frame number S displays source and line for each frame T displays column headers V displays frame type-specific information KBNSV displays all the stack information. |
|
LM/LMX |
List Loaded Modules |
Displays the loaded modules. LMX displays the symbol information for each module as well. |
|
LN |
List Nearest Symbols |
Displays the symbols nearest the given address. This is very helpful when you are spelunking around and need to see what an address might be. |
|
P |
Program Step |
The "Step Over" command. The behavior of this command depends on whether the debugger is stepping through source or disassembly instructions. |
|
T |
Trace |
The "Step Into" command. The behavior of this command depends on whether the debugger is stepping through source or disassembly instructions. |
|
X |
Examine Symbols |
Lists the symbols closest to the wildcard. This command is very helpful when you know part of the symbol name you are looking for. For example, X *printf* will find all references to printf. |
Figure 3 Common WinDBG Dot Commands
|
Command |
Name |
Description |
|
.break |
Debug Break |
Halts the debuggee temporarily and returns control to the debugger. The Ctrl+C key sequence in the Command window does the same thing. |
|
.crash |
Generate Dump File |
Creates a crash dump file for the process being debugged. This is very helpful when you need to show another engineer a situation you encountered while debugging. |
|
.logopen |
Open Log File |
Opens a log file where all information in the Command window is written to the text file. |
|
.logappend |
Append Log File |
Appends information in the Command window to the specified log file. |
|
.logclose |
Close Log File |
Closes the log file. |
|
.opt |
Set Option |
Allows you to set many of the options in the Windows Debugger Options dialog. Use .opt ? to see the options you can set. |
|
.refresh |
Refresh |
Refreshes the debugger state. |
|
.reload |
Reload Symbols |
Reloads all symbol tables currently active. If you have any trouble at all with symbol access, use this command frequently. |
|
.sleep |
Sleep |
Delays execution for the specified number of seconds. This is very useful in scripts. |
|
.source |
Run Script |
Runs a script containing debugger commands. You can specify the complete path and file name for the script. The script parameter does not need quotes. |
|
.title |
Set Title |
Sets the title string for the main window. This is helpful when you have multiple instances of WinDBG running. |
|
.waitforstr |
Wait For String |
Waits for a specific string to come through a call to OutputDebugString. This is very useful in scripts to control execution based on an event. The string to wait on parameter does not need any quotes or parentheses. Just specify the exact text to match. |
Figure 4 WinDBG Extensions
|
Kernel Mode |
Description |
|
GDIKDX.DLL |
Kernel debugging extensions for video device drivers. |
|
KDEXTALP.DLL |
For Alpha CPU device drivers. |
|
KDEXTX86.DLL |
For Intel CPU device drivers. |
|
NDISKD.DLL |
For NDIS network drivers (Windows 2000 only). |
|
USERKDX.DLL |
For USER32 information. This seems to be primarily for debugging things like CSRSS. |
|
User Mode |
Description |
|
NTSDEXTS |
The main user mode informational commands. See Figure 6 for a listing of the key commands. This WinDBG extension is stored in the %SYSTEMROOT%\System32 directory. This is the default WinDBG extension that is loaded. |
|
RPCEXTS.DLL |
Remote Procedure Call information. |
|
USEREXTS.DLL |
USER32 informational commands. There are commands to dump menus, dialog templates, and to convert VK_xxx and WM_xxx values, among other things. |
|
VDMEXTS.DLL |
Virtual MS-DOS Machine debugging extensions. This looks like it is mostly for debugging NTVDM.EXE, but there are commands for working with 16-bit programs. |
Figure 5 Built-in Bang Commands
|
Command |
Name |
Description |
|
!? |
Help |
Displays the list of built-in commands and the current default WinDBG extension help. |
|
!load |
Load WinDBG Extension |
If you are loading one of the supplied extensions, you just need to specify the name without the .DLL extension. If you are loading an extension that is not in one of the default locations, you need to specify the complete path and file name (without the .DLL extension). |
|
!listexts |
List Loaded Extensions |
Lists all loaded extensions. Be aware that this sometimes gets confused and will display incorrect information. This is especially true if you loaded something other than NTSDEXTS as the first extension. |
|
!reload |
Reload Kernel Symbols |
This seems to do the same thing asthe .reload command. When you're having symbol table problems, use both commands. |
|
!unload |
Unload Default WinDBG Extension |
This seems to unload the active WinDBG extension. However, this can get confused and not actually unload anything. |
Figure 6 Common NTSDEXT.DLL WinDBG Extension Bang Commands
|
Command |
Name |
Description |
|
!critsec |
Critical Section Display |
Displays the critical section fields. See the !lock command. |
|
!dh |
Dump Header |
Displays the header information for the specified module. This is a very helpful command to double-check valid modules. |
|
!dll |
Display Loaded DLLs |
The loaded DLLs can be displayed in initialization, load order, or memory address order. Additionally, all the section headers can be displayed. !dll -h shows help on the command. The very useful !dll -c addr will show you the DLL that contains an address. This is very helpful if you need to manually walk a corrupted stack so you can see how you got into the problem situation. |
|
!error |
Translate Error Value |
Translates a Win32 error value into a meaningful string. |
|
!gle |
Last Error Value |
Displays the last error value for the current thread. |
|
!handle |
Handle Information |
Displays handle information for all handles or a specific handle in a process. This super-useful command shows all the information you could ever want about a handle: type attributes, access, handle count, pointer count, and handle-unique information. For example, !handle can show you the state of each event handle you have open. |
|
!heap |
Heap Information |
Displays all sorts of information about operating system heaps created with the HeapCreate API. |
|
!help |
Help |
Many of the NTSDEXTS.DLL commands have additional flags and parameters. Follow !help with the name of the command to get more information about the various commands. |
|
!lock |
Display Critical Sections |
Displays all critical sections in use. Use !lock -v to see all critical sections through the system. !lock by itself will show just the locked critical sections. |
|
!peb |
Display Process Environment Block |
This command can help you see where a process is locating DLLs. |
|
!teb |
Display Thread Environment Block |
Displays the TEB for a particular thread. |
|
!vprot |
Display Virtual Protection Information |
Displays the memory protections for a particular address. This is identical to calling VirtualProtect in your code to view the information. |