![]()
|
This article may contain URLs that were valid when originally published, but now link to sites or pages that no longer exist. To maintain the flow of the article, we've left these URLs in the text, but disabled the links.
|
 |
| Michael Corning |
| Remote Machine Debugging |
The formal name for the new debugger can be a little confusing at first; "remote machine debugging" gives the impression that it only works on servers that are running on machines different than the one used by the debugger. While this advanced feature of remote server debugging is certainly possible in RMD, it works equally well on local servers. Remember that COM works with three kinds of servers: in-process servers are running in the same address space as their clients; local servers are processes running in their own address space on the same machine as the client; and remote servers are processes running on different machines. A key innovation of COM is something called location transparency. To the client, the server always looks the same (it exposes the same interface) regardless of where the server is running. In the beginning, think of the debugger as a client that needs to attach to a program that will always run in a separate address space (see Figure 1). Sometimes this address space is on the same machine as the debugger (local debugging), and sometimes the program is on a different machine than the debugger (remote debugging). I will mainly discuss local debugging here; in a future column I will delve further into the added subtleties of remote debugging. |
 |
| Figure 1: Local and Remote Debugging Modes |
|
Debugging a local or remote server is no mean accomplishment; it is a complex process that depends on many system services to work. As a result, the debugger can be a little temperamental. But when the debugger works, it really does its job, so do whatever it takes to get the debugger to work on your system. Once you have used RMD to peer under the hood of your ASP application (or your Java, Visual Basic®, or ATL component) you will never go back to Visual InterDev 1.0—or Notepad. So stay with me while I describe the process. Because your Web application is hosted out-of-process (OOP), DCOM technology, particularly DCOM security, is at work. Only users with Windows NT® administrator rights can configure DCOM security. If you keep that in mind, much of what follows will be a lot clearer. I will note in passing that you can also manually debug your ASP application when Internet Information Server (IIS) is running in-process by attaching to the inetinfo.exe process instead of letting the debugger attach to the mtx.exe process. But in this installment I'll show you how to run your application under debugger control. In a future column I will show you how to manually attach to in-process servers (and to local and remote servers, too).
Installation and Security
|
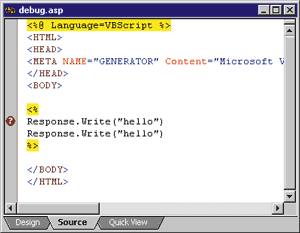 |
| Figure 2: Inactive Breakpoints |
|
The user who installed RMD is automatically listed among the users authorized by DCOM to access and launch two key applications that let the debugger attach to the Web application: Catalog Class and Machine Debug Manager. Generally the first thing a user does after installing Windows NT 4.0 is to log in as an administrator and add their own identity to the administrator group. This is convenient when Visual Studio 6.0 is installed because that administrator-level user is already included among the users who can run the debugger. To
be clear, the user who installs the server components for
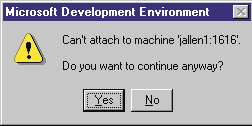
Visual Studio 6.0 will be among the users with access and launch permissions for the Machine Debug Manager. What do you think will happen if the machine you just set up is a laptop? You set it up at work on the corporate network and everything's cool. You take your cool machine home and log in as a local account, open up Visual InterDev 6.0, and keep working on your app. Everything will be fine until you decide to start the debugger. If you did not add your local account to the group(s) you gave debugging permission to above, then the debugger will fail, and you will see one of the dialog boxes shown in Figures 3 and 4. |
 |
| Figure 3: Access Denied |
 |
| Figure 4: User Attempting to Debug is not Listed |
|
With the recently released Service Pack 4 for Windows NT 4.0, these extra steps may not be necessary because SP4 enables DCOM to authenticate the interactive user, something Windows NT 4.0 can't do at this writing. When RMD sets up the server for debugging, it checks to see if the IIS 4.0 application is running out-of-process. If not, it then makes some metabase entries and marks the ASP application to run OOP. Next, RMD checks to see if server-side and client-side debugging options are enabled and turns those two metabase switches on as well, if necessary. If you bring up the Microsoft® Transaction Server (MTS) Explorer after debugging has been enabled, you will see that the OOP Web application has been configured to run with a specific user identity: the name of the last person to debug the application. Since that identity must be the identity of the current interactive user, DCOM will be satisfied. Fortunately, SP4 should be available at http://support.microsoft.com/support/downloads by the time you read this column. Until you install it, you are still responsible for controlling who has authority to debug your applications.
Using Remote Machine Debugging
|
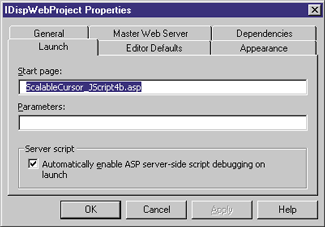 |
| Figure 5: Launch Parameters |
|
First I'll show you what RMD does to Visual InterDev. If you go to the property sheet for your Web project and select the Launch tab, you will see the text fields that contain
the name of the project's startup file and any querystring needed by the application (see Figure 5). You will also see a checkbox that tells RMD to debug your ASP code while your application is running. Note I said ASP. If this box is not checked when you start your application, you will see a dialog that asks if you want to debug ASP files as well as HTML files. If you press OK, you will turn the Launch checkbox on. If you select Cancel you will only have client-side debugging enabled during the current session. When I only want to debug client-side script, I select No because the client-side debugging process takes less time to start than when IIS and MTS have to be configured for server-side debugging. There are several other things you can do to speed up the ASP debugging process. First, permanently host your ASP application in an MTS process. This way RMD doesn't have to do it when the debugging session starts up, and it won't have to take time to return your application to its original in-process state when the debugging session is stopped. Note that if you're going to do this, you must turn off just-in-time (JIT) debugging. Second, turn on the Enable Server and Client Debugging switches in the Configuration dialog App Debugging tab of your ASP app. Again, if this is already set, RMD won't have to take time to enable debugging. (Note: the original Windows NT Option Pack help file says that the ASP client-side script debugging feature is reserved for future use. Welcome to the future!) Being proactive by manually enabling debugging will save you the most time during the development phase of your application. Developing systems on machines that are separate from production computers is a good programming practice. If you set up your development machines to run OOP all the time, and if you enable debugging to run all the time, debugging sessions will run faster. While you probably should continue to host your production applications OOP, enabling full-time debugging is probably not a good idea because of the performance hit debugging exacts. Again, this hit may be a small price to pay for the time you will save on your development machines. Once RMD is finished setting up IIS for ASP server-side debugging, it turns to MTS so that the ASP application's identity is set to the user who logged into the debugging session. Since this setting is left untouched when the debugging session is finished, you can see who last debugged the application by looking on the Identity tab of the out-of-process package's property sheet. Note that when you manually set an ASP application to run in its own address space, the identity of the package is set to the IWAM (anonymous) user. Once RMD gets its hands on the package, that IWAM identity is replaced by the identity of the last debugging user. |
 |
| Figure 6: Alert Dialog |
|
Occasionally, when starting a debugging session you may see the dialog in Figure 6. I found that this happened more frequently when I tweaked Visual InterDev Web Permissions to allow a nonadministrator user to have administrator rights on the project. At any rate, if you see this message, simply open the package in MTS Explorer, go to the Identity tab, and complete the information needed. I've often found that the user name and/or password are missing. Don't worry if the Apply button is disabled; just fill out the form and press OK. Once this process is manually completed, you should not see the dialog in Figure 6 again.
Wrap-Up
For additional details and a handy utility, viddbg.exe, that checks for a system configuration capable of supporting RMD, see the Remote Machine Debugging whitepaper at http://msdn.microsoft.com/vinterdev/technical/articles/develop.asp. |
|
To Do This |
See |
Do This |
Or You May See This |
See |
|
Install the necessary system applications to enable RMD. |
|
Install RMD through the Visual Studio 6.0 setup server component option. |
|
|
|
Have a version of ASP that will support debugging. |
|
Apply a hot fix to ASP that is at least as late as the one that ships with Visual InterDev 6.0 Disk 3 (or Windows NT 4.0 Service Pack 4). |
Breakpoints will be ignored and will probably have a white ? character inside the red bullet. |
Figure 2 |
|
Enable specific users to attach to out-of-process IIS 4.0 applications. |
Figure 7 |
Add users who will have authority to debug to the Catalog Class and Machine Debug Manager appids in dcomcnfg. |
A dialog that says, "Unable to find server" or "Cannot attach to machine
" |
Figure 3 |
|
Provide the simplest, most reliable way to debug an IIS 4.0 application (out-of-process or in-process). |
Figure 8 |
Add debugging user to the Windows NT administrators group. |
Unable to set the server into correct debugging state automatically, or "Unable to attach to the process 'inetinfo.exe'
" |
Figure 4 |
|
Give something for RMD to attach to and begin the debugging session. |
Figure 5 |
Set a page to be the start page, and press F5 or the start tool. |
A dialog that says debugging requires an initial page. |
Figure 9 |
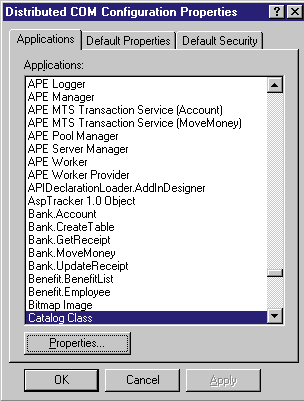 |
| Figure 7: Adding Users |
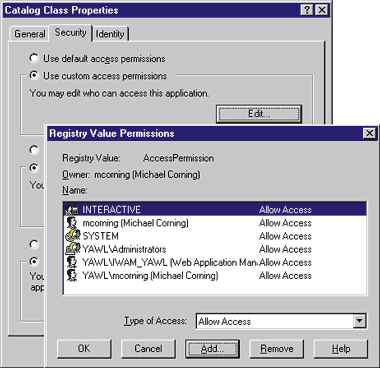 |
| Figure 8: Adding Access Permissions |
 |
| Figure 9: Debugging Requires an Initial Page |
|
From the January 1999 issue of Microsoft Internet Developer.
|