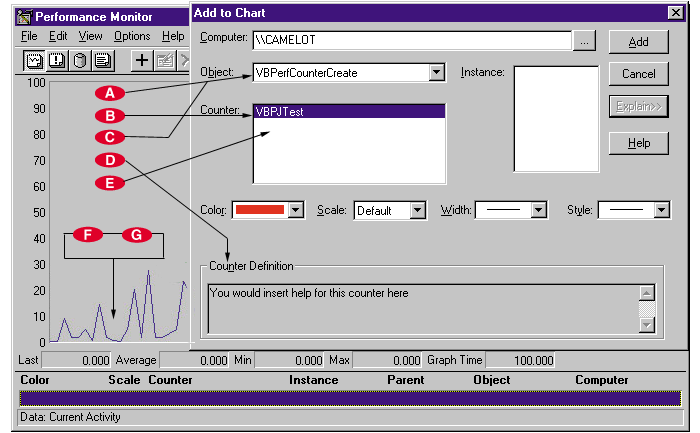
| The Object drop-down box lists the names of all performance objects on your system. | |
| The Counter listbox displays all the counter ob-jects for the selected PO handles. | |
| Both performance and counter objects must implement a method called GetName(). This method returns the name you want displayed in the Object drop-down box. | |
| Both performance and counter objects implement a method called GetHelp(). You display the string this method returns in the Counter Definition textbox. This message tells a user exactly what a given counter object is supposed to do. | |
| This Counter listbox also hosts the GetIndex method. You can't see this method visually, but you can see its results in the display of a counter object. This method enables you to track counter objects. It is one of the trickiest aspects of using the Performance Monitor app, but creating additional counter objects is easy once you get the hang of this method. | |
| The Collect() method displays the graph of your component's performance. The PM calls the Collect() method to retrieve the current value to display in the viewing area. The Collect() method returns a VB Long value that the PM uses to indicate how high on the graph the next point should be. | |
| This area also hosts the GetDataType() method. It currently supports only the vbLong data type. The PM uses this value to graph the height supplied by the Collect() method. |