|
Dimension Name |
Level |
Description |
|
Customers
|
Country, State or Province, City, Name
|
Geographical hierarchy for registered customers of the stores
|
|
Education Level
|
Education Level
|
Education level of a customer, such as graduate degree or high school degree
|
|
Gender
|
Gender
|
Customer gender, M or F
|
|
Marital Status
|
Marital Status
|
Customer marital status, S or M
|
|
Product
|
Product Family, Product Department, Product Category, Product Subcategory, Brand Name, Product Name
|
The products that are on sale in these stores
|
|
Promotion Media
|
Media Type
|
The media used for a promotion, such as daily paper, radio, and so on
|
|
Promotions
|
Promotion Name
|
Identifies the promotion that triggered the sale
|
|
Store
|
Store Country, Store State, Store City, Store Name
|
Geographical hierarchy for different stores in the chain (country, state, city)
|
|
Store Size in SQFT
|
Store Sqft
|
Area occupied by the store, in square feet
|
|
Store Type
|
Store Type
|
Type of store, such as deluxe supermarket
|
|
Time
|
Time
|
Years, quarters, months
|
|
Yearly Income
|
Yearly Income
|
Income of a customer
|
Figure 2 FoodMart Sales Cube Measures
|
Measure Name
|
Description
|
|
Unit Sales
|
Number of units sold.
|
|
Store Cost
|
Cost of goods sold.
|
|
Store Sales
|
Value of sales transactions.
|
|
Sales Count
|
Number of sales transactions.
|
|
Store Sales Net
|
Value of sales transactions less cost of goods sold.
|
|
Sales Average
|
Store Sales/Sale Count. This is a calculated measure.
|
Figure 3 Sales Profit Growth
|
Quarter
|
Month
|
Profit
|
Profit Growth
|
|
Q1
|
|
83,876.11
|
83,876.11
|
|
|
1
|
27,361.20
|
27,361.20
|
|
|
2
|
26,459.12
|
-920.08
|
|
|
3
|
30,055.79
|
3,596.67
|
|
Q2
|
|
79,702.05
|
-4,174.06
|
|
|
4
|
25,766.55
|
-4,289.24
|
|
|
5
|
26,673.73
|
907.18
|
|
|
6
|
27,261.76
|
588.03
|
|
Q3
|
|
84,367.02
|
4,664.98
|
|
|
7
|
30,241.09
|
2,979.33
|
|
|
8
|
27,763.08
|
-2,478.01
|
|
|
9
|
26,362.85
|
-1,400.23
|
|
Q4
|
|
91,665.72
|
7,298.70
|
|
|
10
|
25,440.26
|
-922.59
|
|
|
11
|
32,005.95
|
6,565.69
|
|
|
12
|
34,219.51
|
2,213.55
|
Figure 4 State Metrics by Quarter
|
State
|
Unit Sales
|
Store Cost
|
Store Sales
|
|
|
CA
|
Q1
|
16,890.00
|
14,431.09
|
36,175.20
|
|
|
Q2
|
18,052.00
|
15,332.02
|
38,396.75
|
|
|
Q3
|
18,370.00
|
15,672.83
|
39,394.05
|
|
|
Q4
|
21,436.00
|
18,094.50
|
45,201.84
|
|
OR
|
Q1
|
19,287.00
|
16,081.07
|
40,170.29
|
|
|
Q2
|
15,079.00
|
12,678.96
|
31,772.88
|
|
|
Q3
|
16,940.00
|
14,273.78
|
35,880.46
|
|
|
Q4
|
16,353.00
|
13,738.68
|
34,453.44
|
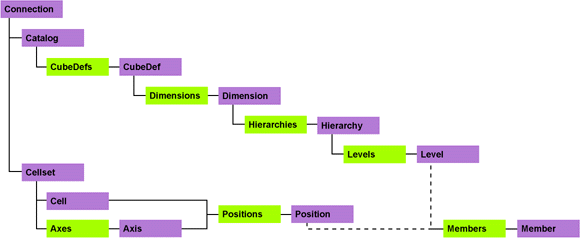
Figure 5 ADOMD Object Model
Figure 6 Using the ALL_MEMBER Property
For Each dimCube In cubFoodMart.Dimensions
    If dimCube.Name = "Measures" Then
        Response.Write dimCube.Hierarchies(0).Levels(0).UniqueName & ".MEMBERS"
        For Each meaCube In dimCube.Hierarchies(0).Levels(0).Members
            strValue = meaCube.UniqueName
            Response.Write "    " & strValue
        Next
    Else
        If IsNull(dimCube.Hierarchies(0).Properties("ALL_MEMBER").Value) Then
            strValue = dimCube.Hierarchies(0).Levels(0).UniqueName & ".MEMBERS"
        Else
            strValue = dimCube.Hierarchies(0).Properties("ALL_MEMBER").Value & _  ".CHILDREN"
        End If
        Response.Write strValue
    End If
Figure 7 Sales Cube Hierarchy
[Customers].[All Customers].CHILDREN
[Education Level].[All Education Level].CHILDREN
[Gender].[All Gender].CHILDREN
[Marital Status].[All Marital Status].CHILDREN
[Measures].[MeasuresLevel].MEMBERS
    [Measures].[Profit]
    [Measures].[Sales Average]
    [Measures].[Unit Sales]
    [Measures].[Store Cost]
    [Measures].[Store Sales]
    [Measures].[Sales Count]
    [Measures].[Store Sales Net]
[Product].[All Products].CHILDREN
[Promotion Media].[All Media].CHILDREN
[Promotions].[All Promotions].CHILDREN
[Store].[All Stores].CHILDREN
[Store Size in SQFT].[All].CHILDREN
[Store Type].[All].CHILDREN
[Time].[Year].MEMBERS
[Yearly Income].[All Yearly Income].CHILDREN