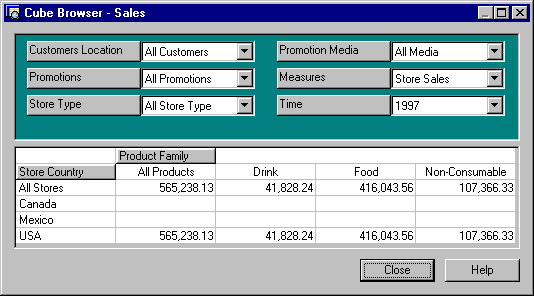
You can quickly change a data grid row or column by dragging a dimension from the slicer pane to the data grid. For example, using the FoodMart sample database, to view sales totals by store location for each product category, perform the following steps:
The Cube browser should now look like this.

For more information about navigating in this view, see Cube Editor - Browse.
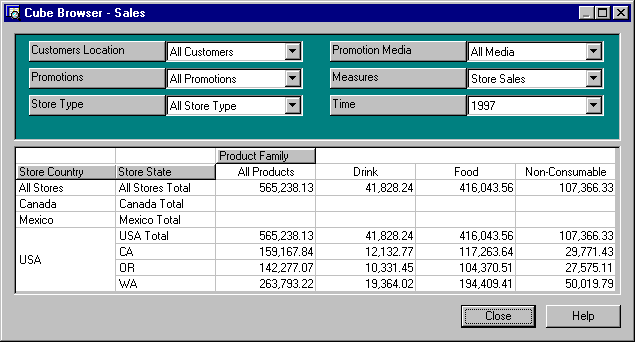
To drill down into a particular level member, double-click the member. In the above example, to drill down into the details of the USA store sales numbers, double-click USA on the row axis. The Cube browser should now look like this.

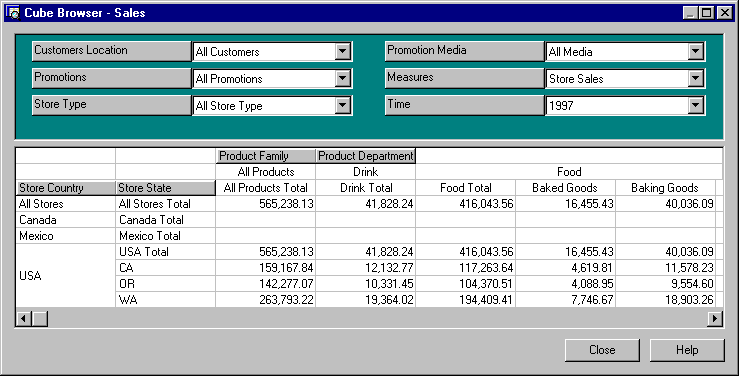
To further drill down into US store sales by individual food categories, double-click Food on the column axis. The Cube browser should now look like this.

Drill down as deep into your cube data as the levels or Cube browser memory allows.
The Cube browser has an internal memory limit which you may reach if you attempt to browse too much data or drill down too deeply. When you reach the limit, the following message is displayed:
Unable to display current view of cube.
Unable to Allocate Memory For Flexgrid.
The limit cannot be increased by adding or allocating more memory. If you reach the limit, reduce the amount or depth of data you are attempting to browse or use another browser.
To filter the cube data, select a member from a levels box. In the above example, to view the data for only small grocery stores, click the Store Type level box, expand the level, and then click Small Grocery.
To view small grocery store sales in the second quarter of 1997, click the Time level box, expand the level, and then click Q2 under 1997.