Creating Traces
Traces can be created using either SQL Server Profiler, Microsoft® SQL Server extended stored procedures, or the Create Trace Wizard. You can create one or more traces using any combination of SQL Server Profiler event classes and event class criteria.
Before creating a trace using SQL Server Profiler, you can specify default trace values in the Options dialog box. The default trace values for SQL Server Profiler are:
- The name of the default computer running SQL Server to be monitored. The default is the local computer.
- The share type, which indicates whether the new trace can be used by other users of the computer on which SQL Server Profiler is installed, or only by the user who creates the trace. The options are Shared or Private (default).
- The event classes available to be traced. The options are Commonly traced event classes (default), which is a subset of the event classes available, or All event classes.
- The data columns (event data) to be monitored. The options are Commonly captured data columns (default), which is a subset of the data columns available, or All data columns.
Additionally, you can specify default display values that determine how SQL Server Profiler displays the running traces, such as starting the trace as soon as it is created, the number of text lines displayed when an event is expanded, the size of the trace buffer, and the font to use.
Note If the trace buffer size is exceeded, the oldest events will be deleted from the trace to allow new events to be captured. The trace buffer size does not apply to traces saved to a file or table.
When creating a trace using SQL Server Profiler, specify:
- A name for the trace. No two other traces on the computer can have the same name and share type.
- The share type (shared or private).
- The name of the computer running SQL Server to be monitored.
- The event classes to capture. For more information about the event classes available, see Events Monitored by SQL Server Profiler.
- The data columns to capture. For more information about the data columns available, see Events Monitored by SQL Server Profiler.
- Any filters you want to use to restrict the event data captured. For more information, see Filtering Events.
- The destination for the captured event data, such as a file or table. For more information, see Saving Traces.
The Create Trace Wizard can create predefined traces that can be used to monitor common problems, such as finding poorly performing queries quickly, identifying large table scans, tracking application, user, and stored procedure usage and performance, and detecting and analyzing deadlocks.
Using Extended Stored Procedures
SQL Server Profiler uses extended stored procedures to create traces from the selections you enter in the user interface. The extended stored procedures are used to create the queues to store events and send the trace output to the appropriate destination. These extended stored procedures can be used from within your own applications to create traces manually, instead of using SQL Server Profiler. This allows you to write custom applications specific to the needs of your enterprise that monitor SQL Server. For example, when using extended stored procedures to create traces, you can:
- Send trace data to the Microsoft Windows NT® application log.
- Autostart a trace when SQL Server starts.
- Forward trace events from one or more servers to another server, file, or table.
- Configure queues and consumers.
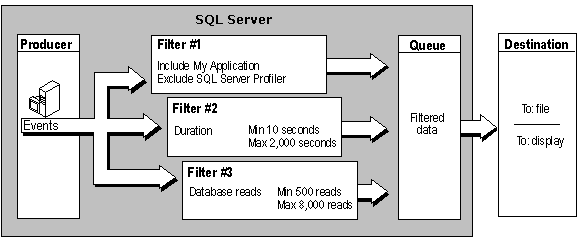
Extended stored procedures expose the underlying architecture used to create traces. The architecture components are:
- Producer
- Generates the events to be monitored. An example of a producer is the SQL Server lock manager, which generates lock events. For more information, see Locks Event Category.
- Filter
- Restricts the data monitored by the trace. For more information, see Filtering Events.
- Queue
- Collects event data and queues the events for asynchronous processing by consumers. The consumer extracts the events from the queue. For example, the file consumer extracts the events from the queue and writes them to a destination file.
- Destination
- The place to send the event data when extracted from the queue. Destinations include files, SQL Server tables, other computers running SQL Server, and the Windows NT application log.

The general steps required to define your own trace using extended stored procedures are:
- Create a new queue using xp_trace_addnewqueue.
- Specify the events to capture using xp_trace_seteventclassrequired.
- Specify any event filters.For more information, see How to set a trace filter (Transact-SQL).
- Specify the destination for the captured event data using xp_trace_setqueuedestination.
 To set trace definition defaults

 To set trace display defaults

 To create a trace


 To create a trace using the Create Trace Wizard

 To add or remove events from a trace


 To modify data columns


(c) 1988-98 Microsoft Corporation. All Rights Reserved.


 To set trace definition defaults
 To set trace display defaults
 To create a trace
 To create a trace using the Create Trace Wizard
 To add or remove events from a trace
 To modify data columns