

| Membership-Specific Terms | Meaning |
| Project | Content deployment project |
| Replication | Running instance of the project |
| Endpoints | Leaf computer that receives the replicated data |
| Framed mode | Method of replication that performs error checking on the received data |
| Chained replication | Method of replication in which data is passed through multiple stages |
| Forced replication | Method of replication in which all data from the sending computer is sent to the receiver without checking to see if the data on the receiver is already there |
This document evaluates the performance and scalability characteristics of the Content Deployment (CD) service. This document also demonstrates procedures for identifying these characteristics. It can be used to assess the value of adding additional resources and to assess which resources would satisfy greater capacity needs.
In three test scenarios, between two and four servers were used in the following configurations:
Content Deployment Processor Scaling
| Sender: | CPU: | 4 x 200-MHz Pentium Pro |
| Memory: | 256 MB of RAM | |
| Disk: | ||
| Network: | 100 BaseT (switched) | |
| Software: | Microsoft® Windows NT® 4.0 Option Pack version 622 (final) (Microsoft® Internet Information Server) | |
| Receivers: | CPU: | 4 x 200-MHz Pentium Pro |
| Memory: | 256 MB of RAM | |
| Disk: | ||
| : | Network | 100 BaseT (switched) |
| Software: | Windows NT 4.0 Option Pack version 622 (final) (Internet Information Server) |
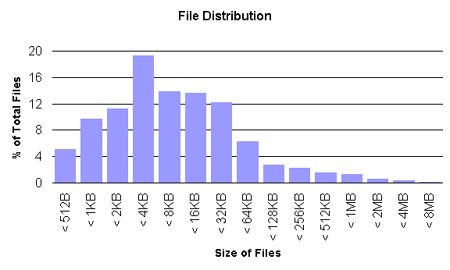
Files were distributed in a ratio to simulate a Web server environment. The following chart shows the distribution. The actual values appear in Appendix A.
Content Deployment (CD) stages and deploys Web pages and other file-based information between directories, among local servers, or across geographically-remote, secured networks to multiple destination servers.
CD is not an authoring tool for Web pages or other content. Rather, it enables the deployment of files, directories, access control lists (ACLs), and metadata from one server to one or more servers located locally, on a corporate intranet, or in other areas of the Internet. CD also quickly, securely, and reliably deploys and installs server applications, including Microsoft® ActiveX® controls and Java applets.
Based on the data collected in this document, the following assertions can be made about scaling and performance for CD:
All replications that run share the same resources. The processor utilization and memory utilization on the senders and receivers will grow with the number of current replications running. However the input/output (I/O) will not increase with more replications.
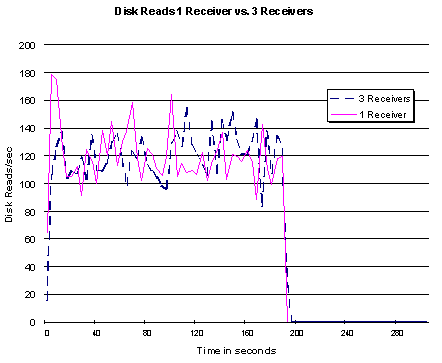
The following chart shows how sending the content to multiple receivers does not increase the disk utilization on the sender, because the file to be sent is now in the system cache.
The information in the chart is from a fast replication in forced mode to one receiving computer versus the same type of replication sent to three receiving computers.
The times of the replications are close, with a difference of less than four seconds.
The following chart illustrates the relative cost in time for a replication with different event settings inside the service. The first column represents the time to do a replication with the events turned off. The next four columns are the different methods of handling the events. Using this functionality adds a modest cost to the overall replication time. This graph compares the different types.
Events are useful to track the progress and status of the CD service. They provide an automatic history mechanism that can be useful to administrators.
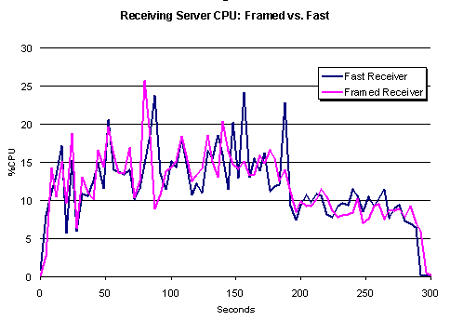
The following two charts show the CPU overhead of turning on the framed mode replication versus the fast mode replication.
The framed mode replication computes an MD5 hash on the data before they are sent and the receiving server computes the same MD5 hash and compares them to assure data integrity over the wire. The CPU cost seems modest, but it should be noted that the following chart depicts total processor utilization on a four-processor Pentium Pro 200 MHz server.
In a simulated environment CD was slightly faster than FTP when transferring one large file across a 50-millisecond delay link. This finding means that the throughput of merely pushing bits across a slow wire is excellent.
This chart shows that CD does a good job using network resources relative to the FTP standard. Also, an interesting note is that across the slow link a framed replication with the entire content set is faster than FTP.
| Transaction | Time in Seconds |
| Fast Mode | 5,895 |
| Framed Mode | 5,882 |
| FTP | 5,982 |
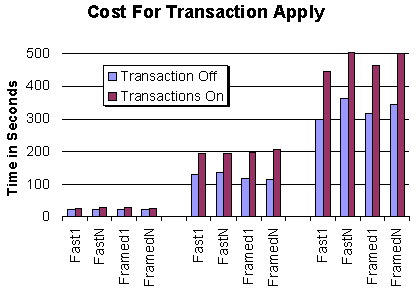
These tables illustrate the relative cost of transactions. It should be noted that the transaction cost time would be smaller as a percentage of total cost for slow network linked systems such as the Internet. The benefit of this mode is data atomicity.
| Transaction | Definition |
| Fast 1 | Default replication from one sender to one receiving server |
| Fast N | Default replication from one sending server to three receiving servers |
| Framed 1 | Default replication in framed mode from one sender to one receiving server |
| Framed N | Default replication in framed mode from one sending server to three receiving servers |
Each replication was performed on a 100 BaseT isolated network without a simulated delay. Churn represents the percentage of files that were touched and thus in need of updating before the replication was started. A zero percent churn means no files were touched. A 30 percent churn means that approximately 30 percent of the files were touched.
TRANSACTIONS OFF
| Transaction | 0% Churn | 30% Churn | 100% Churn |
| Fast 1 | 21 Seconds | 128 Seconds | 297 Seconds |
| Fast N | 21 Seconds | 135 Seconds | 361 Seconds |
| Framed 1 | 20 Seconds | 118 Seconds | 315 Seconds |
| Framed N | 21 Seconds | 114 Seconds | 346 Seconds |
TRANSACTIONS ON
| Transaction | 0% Churn | 30% Churn | 100% Churn |
| Fast 1 | 25 Seconds | 193 Seconds | 445 Seconds |
| Fast N | 27 Seconds | 193 Seconds | 504 Seconds |
| Framed 1 | 28 Seconds | 198 Seconds | 463 Seconds |
| Framed N | 25 Seconds | 206 Seconds | 500 Seconds |
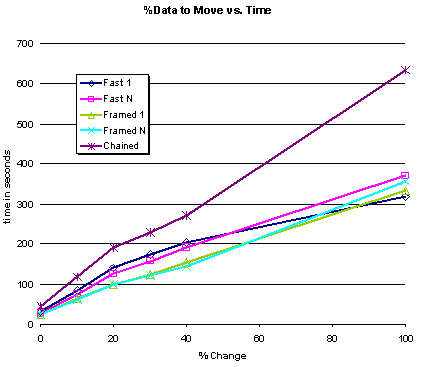
This final chart shows the efficiency of the CD system in determining which files to replicate. CD makes this determination based on modification date, creation date, and byte count.
Churn represents the percentage of files that were touched and thus in need of updating before the replication was started.
| Transaction | 0% Churn | 10% Churn | 20% Churn | 30% Churn | 40% Churn | 100% Churn |
| Fast 1 | 32 | 85 | 140 | 175 | 204 | 319 |
| Fast N | 27 | 74 | 126 | 157 | 190 | 370 |
| Framed 1 | 24 | 64 | 100 | 124 | 154 | 333 |
| Framed N | 24 | 62 | 99 | 122 | 145 | 358 |
| Chained | 44 | 117 | 191 | 229 | 272 | 635 |
| Data | 0 | 10% Churn | 20% Churn | 30% Churn | 40% Churn | 100% Churn |
| # bytes | 0 | 26,544,070 | 61,902,806 | 82,081,697 | 105,252,578 | 291,466,753 |
| # files | 0 | 528 | 1,020 | 1,516 | 1,995 | 5,015 |
| # dirs | 510 for all |
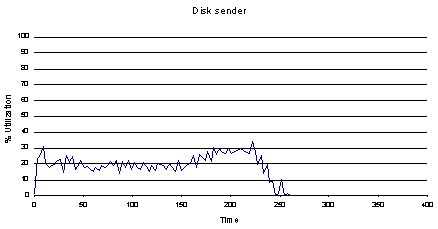
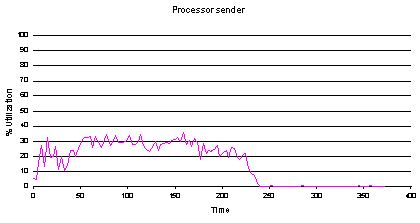
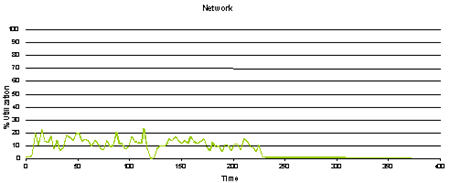
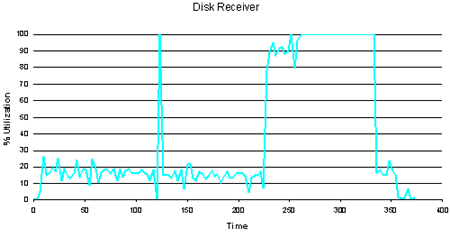
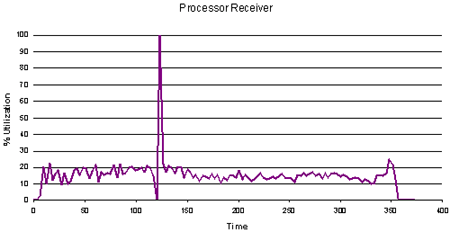
This set of graphs shows how the CD system utilizes the resources of the sending and receiving servers.
The percentage of disk utilization is computed as follows. The number of physical disk reads per second is divided by the maximum number of disk reads the disk subsystem can do, plus the number of disk writes per second which is divided by the maximum number of disk writes the system can do.

The system was calibrated to determine the maximum I/O throughput using the InetMonitor tool.
Network utilization is the performance counter for percentage of network utilization in the Network Segment object.
The processor utilization is the performance counter for percentage of Total Processor Time in the System object.
| Size | % Distribution |
| < 512 B | 5.13 |
| < 1 KB | 9.714 |
| < 2 KB | 11.27 |
| < 4 KB | 19.26 |
| < 8 KB | 13.877 |
| < 16 KB | 13.583 |
| < 32 KB | 12.195 |
| < 64 KB | 6.224 |
| < 128 KB | 2.733 |
| < 256 KB | 2.229 |
| < 512 KB | 1.514 |
| < 1 MB | 1.304 |
| < 2 MB | 0.547 |
| < 4 MB | 0.336 |
| < 8 MB | 0.084 |
All counters noted can be found in the Microsoft® Windows NT® Performance Monitor. These counters will be distributed among the computers in the Personalization and Membership (P&M) service group. The counters in the system and memory objects can be used to monitor capacity.
| Disk Writes/sec | Disk activity should not sustain maximum transaction rate. |
| Disk Reads/sec |
| Context switches/sec | Should be fewer than 15,000 |
| %Total Processor | Should be less than 80 percent |
| %Processor Utilization (average) | Should be less than 80 percent (for each processor) |
| Available Bytes | Should be greater than 4 MB |
| Pages/sec |
| Current Replications Total | Number of active replications |
| Bytes Total/sec | Sum of the network activity generated by service |
| Files Sent/sec | |
| Files received/sec |
Information in this document, including URL and other Internet web site references, is subject to change without notice. The entire risk of the use or the results of the use of this resource kit remains with the user. This resource kit is not supported and is provided as is without warranty of any kind, either express or implied. The example companies, organizations, products, people and events depicted herein are fictitious. No association with any real company, organization, product, person or event is intended or should be inferred. Complying with all applicable copyright laws is the responsibility of the user. Without limiting the rights under copyright, no part of this document may be reproduced, stored in or introduced into a retrieval system, or transmitted in any form or by any means (electronic, mechanical, photocopying, recording, or otherwise), or for any purpose, without the express written permission of Microsoft Corporation.
Microsoft may have patents, patent applications, trademarks, copyrights, or other intellectual property rights covering subject matter in this document. Except as expressly provided in any written license agreement from Microsoft, the furnishing of this document does not give you any license to these patents, trademarks, copyrights, or other intellectual property.
© 1999-2000 Microsoft Corporation. All rights reserved.
Microsoft, Windows, and Windows NT are either registered trademarks or trademarks of Microsoft Corporation in the U.S.A. and/or other countries/regions.
The names of actual companies and products mentioned herein may be the trademarks of their respective owners.