

| Site Server 3.0 Commerce Edition—Specific Terms | Meaning |
| ASP | ASPs (Active Server Pages) are pages of information transmitted by the SSCE server to the client’s browser. ASPs are the building blocks of shopper operations and the primary unit of measure for SSCE performance (ASP requests/sec). |
| CPU cost | CPU resources needed to perform a single shopper operation. |
| Frequency | Operations performed per second by a single shopper. |
| Optimal performance | Highest measured performance for a specific shopper operation with lowest measured CPU cost.
CPU cost increases geometrically when context switching exceeds 15,000/sec. Hence, optimal performance measurements are taken before context switching hits this threshold. |
| Maximum performance | Highest measured performance for a specific shopper operation without consideration for CPU cost.
As ASP throughput approaches its peak, CPU is used less efficiently. On 2-processor and 4-processor servers, this loss of CPU efficiency is due primarily to a geometric increase in context switching. |
| Shopper | User connected to an SSCE server by a Web browser. |
| Shopper Profile | Description of shopper behavior created by the site builder that is used to project shopper capacity. The Shopper Profile is constructed of a series of shopper operations used in specified proportions within a given period of time. |
| Shopper operation | An action performed by a shopper while visiting the store. Sample operations include browsing products, adding a product to the shopping basket, and purchasing a product. |
| SSCE | Microsoft® Site Server 3.0 Commerce Edition. |
| VC | SSCE sample site (store) named Volcano Coffee. |
| General Terms | Meaning |
| Context switching | The rate at which one thread is switched to another (either within a process or across processes). |
| Pentium Pro equivalent MHz (PPEM) | A unit of measure for processor work. 200 Pentium Pro equivalent MHz (PPEM) is delivered by a 200 MHz Pentium Pro processor. A computer with two 200 MHz Pentium Pro processors will deliver a maximum of 400 PPEMs. |
This document evaluates the performance and scalability characteristics of the Volcano Coffee (VC) sample store found in Microsoft® Site Server 3.0 Commerce Edition (SSCE). Using the VC store performance characteristics strictly as an example, the purpose of this document is to provide a methodology for making decisions about capacity planning based on a uniquely designed Commerce site. Procedures for identifying these characteristics are demonstrated. Then, using these procedures, one can pinpoint how user load impacts hardware resources and which resources are likely to be bottlenecks in performance. It is then possible to calculate capacity (maximum concurrent users or shoppers) for a particular hardware configuration and ascertain which additional resources can be added to satisfy greater capacity needs.
The first step in analyzing the performance of a store is to break it down into its individual components, which can be called shopper operations. A shopper logs in, enters the store, browses products, makes a purchase, and then leaves the store. Each of these activities is referred to as a shopper operation.
Once these shopper operations are identified, a profile can be created to approximate the behavior of an average shopper visiting this store. In essence, the Shopper Profile simulates the mix of shopper operations executed during a single shopper visit. The Shopper Profile also estimates the average length of time a shopper will spend in the store.
The performance of each shopper operation in the Shopper Profile can be accurately measured using the InetMonitor simulator. User load is gradually increased on the SSCE server (for a particular shopper operation) until optimal performance is achieved, at which point measurements are taken for each hardware resource (CPU, disk, network and memory).
Note Performance is defined in terms of operations per second. More operations per second mean higher performance. Optimal performance is defined as maximum performance with minimum cost. Characteristically, as shopper load is increased, a threshold is reached at which greater performance is achieved only with a significant increase in cost. In terms of CPU utilization, for example, this would mean that CPU utilization is rising much faster (proportionately) than the increase in performance. Optimal performance would be achieved prior to this increase in cost.
Resource cost is calculated by dividing resource utilization by the optimum performance rate. For example, consider a shopper operation which has an optimal performance rate of 10 operations per second and that this rate generates 60 percent CPU utilization on a 1-processor 200 MHz Pentium Pro server. Using PPEM (Pentium Pro Equivalent Megahertz) as the unit of cost, 10 operations/sec generates 120 PPEMs. So the cost of a single shopper operation is 12.0 PPEMs.
| 10 operations/sec | Generates | 60 percent CPU utilization |
| 60 percent CPU utilization | equals | 120 PPEM |
| resource cost | equals | 120 PPEM / (10 operation/sec) |
| resource cost | equals | 12.0 PPEM per operation/sec |
A model is designed in which total resource cost is calculated for a variable number of concurrent shoppers. Essentially:
C = n × K
Where C is resource cost, n = number of concurrent shoppers and K is the sum of the costs of each shopper operation.
Separate equations are created for each type of resource (CPU, memory, disk, and network). Given this, it is possible to intelligently predict the maximum number of shoppers a particular hardware configuration can support, or conversely, the hardware resources required for a given number of shoppers.
The accuracy of these calculations is confirmed by comparing the results of the calculations with a series of verification tests. A test script is created which simulates shopper behavior defined in the Shopper Profile. Then predicted resource costs calculated from the model are charted against actual resource costs generated by running the verification script.
Given a model for predicting resource requirements, it is important to test scalability. If, for example, it is determined that SSCE is processor bound, how will increasing the number of processors increase capacity? And how well does an SSCE server scale from one, to two, to four processors? Because tests have shown that, for the Volcano Coffee (VC) site, memory, disk and network resources are not limiting factors, this document will focus primarily on how CPU utilization affects VC performance. Costs are compared for 1-processor, 2-processor and 4-processor servers to determine benefits.
Two servers were used in these tests in the following configurations:
| SQL Server: | CPU: | 4 x 200-MHz Pentium Pro |
| Memory: | 256 MB of RAM | |
| Disk: | 2 x 4.3-GB SCSI (280 read/writes per second) | |
| Volumes: | C: (2.0-GB FAT), D: (6.0-GB NTFS) | |
| Network: | Intel EtherExpress Pro/100+ on 100 MB switched Ethernet | |
| Software: | Microsoftâ SQL ServerÔ version 6.5 SP4 | |
| SSCE server: | CPU: | 1 x 200-MHz Pentium Pro |
| Memory: | 384 MB of RAM | |
| Disk: | 1 x 4.3-GB SCSI | |
| Volumes: | C: (4.0-GB NTFS) | |
| Network: | Intel EtherExpress Pro/100+ on 100 MB switched Ethernet | |
| Software: | Microsoft® Internet Information Server version 4.0, Microsoft® Site Server 3.0 Commerce Edition |
Note The SSCE server is a 1 x 200 Pentium Pro computer (1-processor). However, where noted, 2-processor and 4-processor configurations are also used (primarily for discussions of scalability).
Microsoft® Site Server 3.0 Commerce Edition (SSCE) enables businesses to create and manage cost-effective online sites that offer customers and business trading partners a convenient, compelling, and secure buying experience. SSCE can be integrated with any of the Microsoft® Open Database Connectivity (ODBC)-compliant database systems, including Microsoft® SQL Server™ and Oracle.
SSCE is accessed using the standard HTTP interface for Web browsers. It is flexible enough to span multiple servers for redundancy and/or increased scalability. A typical system configuration might consist of two servers, one for SSCE and another for the SQL Server database.
Note It would be wise to consider including a second SSCE server for site redundancy.
Chart 1: Client/Server Structure of Commerce Service
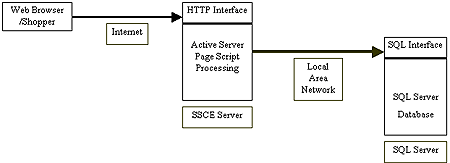
The Volcano Coffee store is a sample site that comes with SSCE 3.0, representing a fictitious retailer of products for coffee lovers. A shopper logs in, enters the store, browses through different pages of coffee products, adds a product to the shopping basket, and then makes a purchase. These are specific types of operations a shopper might perform within the Volcano Coffee store.
Table 1 lists of most of the types of operations that can be performed while visiting the VC store. There are 13 separate shopper operations shown here. Each operation is constructed from one or more Active Server Page (ASP) scripts that are listed alongside the shopper operation.
Performance of each shopper operation is measured using the InetMonitor simulator in conjunction with the PerfMon performance monitor (InetMonitor scripts to simulate each shopper operation can be found in Appendix F. Relevant PerfMon counters are found in Appendix E). Using InetMonitor test scripts to test each shopper operation, performance is measured in terms of ASP requests per second. In all cases (except for checkout—for checkout, one operation is completed after three ASP requests, so the number of checkout operations per second will be one third of the ASP throughput), one ASP request equals one shopper operation.
Note In the additem, checkout, clearitems, and delitem scripts found in Appendix F, the test loop is so small that the initial lookup ASP needs to be factored out of the performance measurement. In addition, additem needs to be factored out of the checkout operation. It is included in the script because an item needs to be in the shopping basket prior to checkout. For the clearitems and delitem operations, shopper baskets must be prepped with product items (using the additem script) in order to provide accurate test measurements.
Table 1: Shopper Operations found in the Volcano Coffee Store
| VC Shopper Operation | Description | ASP Scripts Tested |
| Additem | Add item to basket | xt_orderform_additem.asp |
| Basket | View contents of basket | basket.asp |
| Checkout | Purchase items in basket | checkout-ship.asp, xt_orderform_prepare.asp, xt_orderfor_purchase.asp |
| Clearitems | Clear all items from basket | clear_items.asp |
| Default | Starting page | default.asp |
| Delitem | Remove item from basket | del_item.asp |
| Listing | Show all items in store | listing.asp |
| Lookup | Look up returning shopper | xt_shopper_lookup.asp |
| New | Register a new shopper | xt_shopper_new.asp |
| Main | Show list of departments | main.asp |
| Product | Browse a product | product.asp |
| Search | Search for a product | srchresult.asp |
| Welcome | Welcome page | welcome_lookup.asp, or welcome_new.asp |
Given the average length of a shopper session and the average number of times each shopper operation is performed during a session, a Shopper Profile can be created to simulate the behavior of a typical shopper visiting the VC store. In the following table, a Shopper Profile is constructed in which 19.0 operations of various types are performed during a 20-minute session.
The frequency value converts operations per session into operations per second (for a single shopper). Frequency values will become important later in this document when total resource cost for this shopper profile is calculated. The primary function of frequency is to make it easy to determine, for any number of shoppers, how often a particular shopper operation will be performed. For example, in this profile, one shopper performs 0.001667 basket operations per second. So 300 shoppers would perform 0.50 basket operations per second (300 × 0.001667 = 0.50).
Table 2: Shopper Profile Used in this Report
| VC Shopper Operation | Operations/Session | Frequency |
| Additem | 1.50 | 0.001250/sec |
| Basket | 2.00 | 0.001667/sec |
| Checkout1 | 0.50 | 0.000417/sec |
| Clearitems | 0.50 | 0.000417/sec |
| Default | 1.00 | 0.000833/sec |
| Delitem | 0.50 | 0.000417/sec |
| Listing | 0.50 | 0.000417/sec |
| Lookup | 1.00 | 0.000833/sec |
1. Checkout consists of three separate ASP scripts, so 0.5 shopper operations equals 1.5 ASP requests.
| New2 | 0.00 | 0.000000/sec |
| Main | 2.50 | 0.002084/sec |
| Product | 6.00 | 0.005000/sec |
| Search | 2.00 | 0.001667/sec |
| Welcome | 1.00 | 0.000833/sec |
| 20 minute session | 19.00 operations | 0.015827/sec |
2. This operation, register a new shopper, is not being tested in this example. For simplicity, all shoppers are considered return shoppers in this Shopper Profile.
Based on the data collected in this document, the following assertions can be made about scaling and performance for SSCE 3.0 using the Volcano Coffee store. Note that any references to performance are given in terms of ASP throughput (ASP requests per second).
Note ASP requests are not quite the same as shopper operations. The Shopper Profile indicates that a single shopper performs 19.0 shopper operations in 20 minutes, and that these 19 shopper operations are equivalent to 20.0 ASP requests.
Every shopper who connects to the SSCE server and logs in to the VC store incurs a CPU cost (which can be measured in PPEMs). As more shoppers enter the store, CPU cost increases. Using the Shopper Profile as a guideline, CPU cost for a specific number of shoppers can be determined using the costs for individual shopper operations in conjunction with the processor calculations described in the next chapter. The following chart shows the relationship between CPU cost and number of shoppers as determined by these calculations. Based on these calculations, the projected capacity for this SSCE server is 400 concurrent shoppers in the Volcano Coffee store, regardless of processor configuration.
Note The configuration of this SSCE server is described in the Overview section of Chapter 1.
Chart 2: Scaling Projections for CPU Utilization
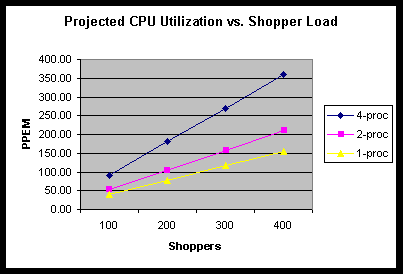
With more processors comes a proportionate loss in CPU efficiency (more CPU cycles required to perform shopper operations). Hence, there does not appear to be any advantage to using Volcano Coffee with a 2-processor or 4-processor SSCE 3.0 server.
In this chapter, resource costs are calculated for each operation (CPU, network and disk). These costs are displayed in cost tables (Tables 3, 4 and 5). Costs are calculated by dividing the resource utilization by operations per second.
Note The unit of measure is actually ASP requests per second, or ASP throughput. This value is easily translated to operations per second. For all cases but checkout, operations/sec is equal to ASP throughput. For checkout, operations/sec is one third of ASP throughput.
Operations per second is determined by running the InetMonitor test scripts found in Appendix F and taking measurements that show optimal performance for each shopper operation. Resource utilization is simply the amount of CPU, network or disk being used when throughput is optimal.
Note For 2-processor and 4-processor SSCE servers, it is not uncommon to see context switching approach 50,000/sec for high user load. Typically, ASP throughput decreases when context switching exceeds 15,000/sec. Occasionally, ASP throughput will continue to increase with higher numbers of context switches, but operation cost (PPEM per operation) will also increase rapidly beyond this threshold. Hence, measurements for peak throughput on 2-processor and 4-processor servers are most often taken when context switching does not exceed 15,000/sec in order to identify maximum throughput at least cost.
Using the values in the cost tables in conjunction with the frequency values calculated from the Shopper Profile (Table 2), resource calculations can be created to project resource costs for any given number of shoppers. These resource costs can be charted and, from the charts, capacity can be easily determined. For a clearer understanding of how total resource cost is calculated, the procedure is demonstrated in a step-wise fashion.
The following table shows the cost (in PPEMs) for each VC shopper operation using a 1-processor SSCE server
Note For a comparison of processor usage on 2-processor and 4-processor servers see Appendix B.
Table 3: CPU Cost for VC Operations using 1-processor SSCE
| VC Shopper Operation | Operations per Second | %CPU | PPEM Cost3 |
| Additem | 2.168 | 71.527% | 65.978 |
| Basket | 8.728 | 88.981% | 20.390 |
| Checkout4 | 0.903 | 56.218% | 100.014 |
| Clearitems | 9.384 | 82.046% | 17.487 |
| Default | 28.330 | 86.535% | 6.109 |
| Delitem | 3.633 | 86.094% | 47.390 |
| Listing | 5.533 | 78.618% | 28.418 |
| Lookup | 12.781 | 67.063% | 10.494 |
| New | 12.196 | 70.535% | 11.567 |
| Main | 8.839 | 78.178% | 17.689 |
| Product | 6.033 | 66.962% | 22.199 |
| Search | 8.205 | 65.677% | 16.009 |
| Welcome | 31.878 | 85.463% | 5.362 |
3. PPEM cost per operation, or number of PPEMs used to generate a single operation. So a cost of 32.68 means one operation requires 32.68 PPEMs of CPU.
4. Because checkout uses three ASPs, operations/sec is equal to one third of ASP throughput, and CPU cost is the sum of the costs of each of the three ASPs.
It is important to note that all shopper operations access the SQL Server database on the SQL Server computer except for the default and welcome operations. Not surprisingly, these operations (default and welcome) show the highest throughput rates (operations/sec) and lowest costs per operation, which underlines the impact on ASP performance when SQL Server does need to be accessed.
Table 4 shows estimated network cost for client-to-server and SSCE-to-SQL connections. When a shopper performs a VC operation, this action will generate network traffic between Web client and SSCE server as well as between the SSCE server and the SQL Server computer (if the SQL Server database needs to be accessed).
The additem operation, for example, shows that optimal throughput is 2.168 operations per second. The network cost of additem is 5.627 kilobytes (KB)/sec per operation between Web client and SSCE server and a 129.01 KB/sec between SSCE and SQL. Note that most of the traffic generated by the additem operation is between SSCE and the SQL Server database.
Table 4: Network Cost for VC Operations using a 1-processor SSCE
| VC Operation | Ops/sec | NetSSCE Cost5 | NetSQL Cost6 | NetTOT Cost7 |
| Additem | 2.168 | 5.627 | 129.601 | 135.23 |
| Basket | 8.728 | 2.750 | 4.010 | 6.76 |
| Checkout | 0.903 | 24.489 | 55.215 | 79.70 |
| Clearitems | 9.384 | 10.763 | 5.392 | 16.16 |
| Default | 28.330 | 1.941 | 0.000 | 1.94 |
| Delitem | 3.633 | 33.412 | 10.293 | 43.71 |
| Listing | 5.533 | 25.664 | 23.134 | 48.80 |
| Lookup | 12.781 | 14.475 | 0.861 | 15.34 |
| Lookup_new | 12.196 | 18.859 | 0.492 | 19.35 |
| Main | 8.839 | 24.437 | 9.503 | 33.94 |
| Product | 6.033 | 21.548 | 21.051 | 42.60 |
| Search | 8.205 | 20.719 | 10.725 | 31.44 |
| Welcome | 31.878 | 17.881 | 1.380 | 19.26 |
5. NetSSCE Cost equals bytes transmitted per operation between the Web client and the SSCE server.
6. NetSQL Cost equals bytes transmitted per operation between the SQL Server computer and the SSCE server.
7. NetTOT Cost equals total bytes transmitted per operation on a conventional (unswitched) Ethernet LAN. On a switched Ethernet LAN network, costs are separate because the segments are isolated. On conventional Ethernet LANs, the costs are added together.
Table 5 shows disk cost for each operation in the VC store. Disk cost is tracked for SQL Server only (SSCE disk is rarely used, although it could be invoked to load ASP files. However, by default, Microsoft® Internet Information Server (IIS) 4.0 keeps all ASP files in cache). Percent disk utilization is based on a calibration of a maximum of 280 random seeks per second. For example, when the SSCE server generates 2.168 additem operations, the SQL Server computer performs 9.530 disk seeks (for a disk utilization of 3.404 percent). Disk cost is calculated by dividing disk seeks/sec by operations/sec. So additem generates 4.395 disk seeks per shopper operation.
Table 5: Disk Cost for VC Operations using a 1-processor SSCE
| VC Operation | Ops/sec | Disk Seeks/sec | %Disk | Disk Cost8 |
| Additem | 2.168 | 9.530 | 3.404% | 4.395 |
| Basket | 8.728 | 7.050 | 2.518% | 0.808 |
| Checkout | 0.903 | 19.688 | 7.031% | 7.266 |
| Clearitems | 9.384 | 8.956 | 3.199% | 0.954 |
| Default | 28.330 | 0.248 | 0.089% | 0.009 |
| Delitem | 3.633 | 4.628 | 1.653% | 1.274 |
| Listing | 5.533 | 0.148 | 0.053% | 0.027 |
| Lookup | 12.781 | 0.063 | 0.023% | 0.005 |
| Lookup_new | 12.196 | 9.275 | 3.313% | 0.760 |
| Main | 8.839 | 0.120 | 0.043% | 0.014 |
| Product | 6.033 | 0.103 | 0.037% | 0.017 |
| Search | 8.205 | 0.100 | 0.036% | 0.012 |
| Welcome | 31.878 | 0.080 | 0.029% | 0.003 |
8. Disk Cost per operation is in terms of seeks/sec per ASP operation.
Resource usage calculations are created to answer the question: What is the cost to this resource to support a given number of shoppers? Given this information, the next question is: What is the maximum number of shoppers this configuration of resources can support?
Using the Shopper Profile (found in Table 2) with the CPU, network and disk tabulations (found in Tables 3, 4 and 5), it is possible to project resource cost for a given number of shoppers and intelligently predict maximum number of shoppers for a particular hardware configuration.
In order to determine capacity for each resource, equations can be designed that measure resource cost against the number of shoppers. From the Shopper Profile, we are given the frequency (see Table 2) for each shopper operation in the Shopper Profile. Frequency is equivalent to the number of operations executed per second for a single shopper. If we know the total number of shoppers, we can come up with a value for total operations per second for a given shopper operation. In other words:
T = n × f
Where:
T= total operations per second (for all shoppers)
n = number of shoppers
f =frequency (operations per second per shopper)
Tables 3, 4 and 5 give us the observed cost for each shopper operation. If we multiply observed cost for each shopper operation by total operations executed per second, we can calculate total resource cost for a shopper operation.
c = T × k
Where:
c = total resource cost for a shopper operation (in PPEMs)
T = operations executed per second
k = observed cost for a shopper operation
Next, we can calculate total resource cost from the sum of the total resource cost for each shopper operation found in the Shopper Profile. Given the 13 shopper operations listed in the profile, our equation expands in the following way:
C = c1 + c2 + c3 + c4 + c5 + c6 + c7 + c8 + c9 + c10 + c11 + c12 + c13
In essence, we are creating a weighted average cost for all operations in the profile. Operations that are used most often are given the greatest weight. This gives shopper operations such as product (browse a product), and main (show a list of departments in the store), extra weight because they have the highest frequency values in the Shopper Profile.
Capacity limits are created when cost for a particular resource reaches the optimal maximum. For example, the optimal maximum CPU cost on a 4-processor server is 440 PPEM (55 percent CPU utilization). Taking into consideration the optimal maximum, we must make sure that our total resource cost calculation does not exceed this limit. So our final equation looks like the following:
C = min[(c1 + c2 + c3 + . . . + c12 + c13),M]
Where:
C = total resource cost for all VC operations
cn = total resource cost for a single VC operation
M = optimal maximum
Before we look at specific components of the CPU, disk and network calculations, let’s take a closer look at the Shopper Profile. Using the number of concurrent shoppers to determine maximum capacity is difficult if we do not take into consideration shopper behavior. Once logged in, how long will the shopper remain in the store? How many and what types of operations will be performed? These questions are answered in the Shopper Profile displayed in Table 2.
Using the Shopper Profile table (Table 2), we know that each shopper connection will consist of an average of 19.0 shopper operations over a period of 20 minutes. And the distribution of operations performed listed in the table shows, for example, that the basket operation would be invoked 2.0 times during the 20-minute session. Converting operations per session into operations per second gives us a frequency value of 0.001667 operations/sec for a single shopper.
If we know the frequency value f, we can determine total operations per second (T) for each shopper operation in the profile for any given number of shoppers n.
T = n × f
Where:
T= total operations per second
n = number of shoppers
f=frequency (operations per second per shopper)
Using the basket example again, the equation becomes:
T = n × 0.001667
If we wanted to find out how many basket operations are generated per second for 300 concurrent shoppers, the equation becomes:
T = 300 × 0.001667 = 0.5
So, 300 concurrent shoppers will generate 0.5 basket operations per second.
Total CPU cost is calculated from the sum of the costs of the individual shopper operations. For each shopper operation, the total operations per second (T = n × f) is multiplied by the CPU cost (P) tabulated in the CPU cost table (Table 3). The following formula shows CPU cost multiplied by total operations per second (T) for each VC shopper operation. Maximum cost is 160 PPEM:
Note Based on test observations, optimal performance is achieved at a maximum of 160 PPEM (80% CPU utilization) for this 1-processor SSCE configuration.

Key
| P | Cost (in PPEMs) | 160 | Maximum optimal PPEM |
| AI | Total additems operations/sec | B | Total basket operations/sec |
| C | Total checkout operations/sec | CI | Total clearitems operations/sec |
| D | Total default operations/sec | DI | Total delitem operations/sec |
| PL | Total listing operations/sec | SL | Total lookup operations/sec |
| NS | Total new operations/sec | MD | Total main operations/sec |
| PB | Total browse operations/sec | PS | Total search operations/sec |
| W | Total welcome operations/sec |
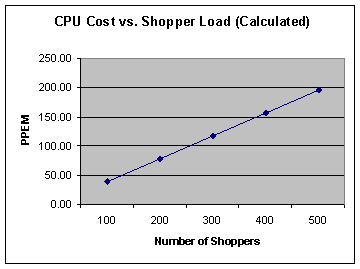
Plugging in T values for each shopper operation solves the equation. The value T varies with the number of shoppers. The total CPU cost P is solved for different numbers of shoppers in the following chart.
If maximum PPEM for a 1-processor SSCE server is 160 (80 percent CPU utilization), this chart suggests that projected capacity is reached with approximately 400 concurrent shoppers.
Chart 3: Projected CPU Costs for 1-processor SSCE
Like the processor calculations, total network cost is calculated from the sum of the costs of the individual shopper operations. However, two network costs are associated with each shopper operation: the connection between Web client and SSCE server, and the connection between the SQL Server computer and the SSCE server. These costs need to be solved separately, and then totaled.
Note On a switched Ethernet LAN, traffic is isolated, so network costs are not added together. On conventional unswitched Ethernet LANs, network traffic is cumulative, and so network costs are added together.
For each shopper operation, total operations per second (T = n × f) is multiplied by the network cost (C) tabulated in the network cost table (Table 4). The following formulas show network costs multiplied by total operations per second (T) for each VC shopper operation:
KSSCE = (AI × 5.63) + (B × 2.75) + (C × 24.49) + (CI × 10.76) + (D × 1.94) +
(DI × 33.41) + (PL × 25.66) + (SL × 14.48) + (NS × 18.86) + (MD × 24.44) + (PB × 21.55) + (PS × 20.72) + (W × 17.88)
KSQL =(AI × 129.60) + (B × 4.01) + (C × 55.22) + (CI × 5.39) + (DI × 10.29) +
(PL × 23.13) + (SL × 0.86) + (NS × 0.49) + (MD × 9.50) + (PB × 21.05) + (PS × 10.73)
KTOT = KSSCE + KSQL
Key
| K | Cost (in kilobytes ( KB) per second) | AI | Total additems operations/sec |
| B | Total basket operations/sec | C | Total checkout operations/sec |
| CI | Total clearitems operations/sec | D | Total default operations/sec |
| DI | Total delitem operations/sec | PL | Total listing operations/sec |
| SL | Total lookup operations/sec | NS | Total new operations/sec |
| MD | Total main operations/sec | PB | Total browse ops/sec |
| PS | Total search operations/sec | W | Total welcome operations/sec |
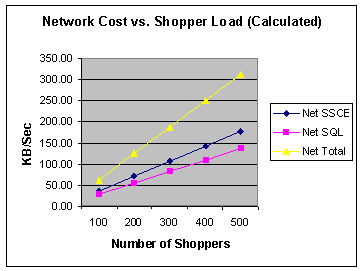
Plugging in T values for each shopper operation solves the equation. The value T varies with the number of shoppers. The total network cost K is solved for different numbers of shoppers in the following chart. Using the chart below, it is shown that if projected peak load is 400 shoppers, total network cost would be 250.14 KB/sec (or 1.95 MB/sec), for a conventional, unswitched Ethernet LAN.
Chart 4: Projected Network Cost for 1-processor SSCE
Like the processor and network calculations, total disk cost is calculated from the sum of the costs of the individual shopper operations. For each shopper operation, the total operations per second (T = n × f) is multiplied by the disk cost (K) tabulated in the disk cost table (Table 5). The following formula shows disk costs multiplied by total operations per second (T) for each VC shopper operation:
K = (AI × 4.395) + (B × 0.808) + (C × 7.266) + (CI × 0.954) + (D × 0.009) +
(DI × 1.274) + (PL × 0.027) + (SL × 0.005) + (NS × 0.760) + (MD × 0.014) +
(PB × 0.017) + (PS × 0.012) + (W × 0.03)
Key
| K | Cost (in disk seeks/sec) | AI | Total additems operations/sec |
| B | Total basket operations/sec | C | Total checkout operations/sec |
| CI | Total clearitems operations/sec | D | Total default operations/sec |
| DI | Total delitem operations/sec | PL | Total listing operations/sec |
| SL | Total lookup operations/sec | NS | Total new operations/sec |
| MD | Total main operations/sec | PB | Total browse ops/sec |
| PS | Total search operations/sec | W | Total welcome operations/sec |
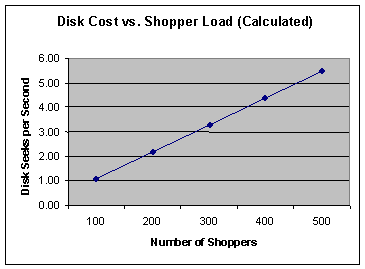
Plugging in T values for each shopper operation solves the equation. The value T varies with the number of shoppers. The total disk cost K is solved for different numbers of shoppers in the following chart.
This chart shows disk seeks climbing to 4.38 seeks/sec for a projected peak load of 400 users. Given that disk performance for the SQL Server computer was calibrated at 280 random seeks per second, this translates to a disk utilization of 1.56 percent.
Chart 5: Projected Disk Costs for 1-processor SSCE
This example illustrates how to project SSCE server resource requirements for a given number of shoppers. Using the Shopper Profile in Table 2, we will include, as an example, the following information regarding the shopper community:
10,000 total shoppers
3 percent online at peak time = 300 users (concurrent)
Use this information to fill in the Shopper Profile equation for each shopper operation:
T = n × f
Where T = total operations per second (for all shoppers), n = number of concurrent shoppers and f = frequency (operations per second for a single shopper).
Table 6: Determining T Value for Each VC Shopper Operation
| VC Shopper Operation | T = Total Operations/sec | n= # Shoppers | f=Frequency9 |
| Additem (AI) | 0.375 | 300 | 0.001250/sec |
| Basket (B) | 0.500 | 300 | 0.001667/sec |
| Checkout (C) | 0.125 | 300 | 0.000417/sec |
| Clearitems (CI) | 0.125 | 300 | 0.000417/sec |
| Default (D) | 0.250 | 300 | 0.000833/sec |
| Delitem (DI) | 0.125 | 300 | 0.000417/sec |
| Listing (PL) | 0.125 | 300 | 0.000417/sec |
| Lookup (SL) | 0.250 | 300 | 0.000833/sec |
| New (NS)10 | 0.000 | 300 | 0.000000/sec |
| Main (MD) | 0.625 | 3007 | 0.002084/sec |
| Product (PB) | 1.500 | 300 | 0.005000/sec |
| Search (PS) | 0.500 | 300 | 0.001667/sec |
| Welcome (W) | 0.250 | 300 | 0.000833/sec |
9. Frequency is calculated in the Shopper Profile table (Table 2).
10. New operation was tested individually, but not included in this Shopper Profile.
Total CPU cost is calculated from the sum of the costs of the individual shopper operations. In the following formula, total operations per second (T) for each shopper operation is multiplied by the CPU cost of the operation (CPU costs are derived from the CPU cost table shown in Table 3). T is a variable whose value is dependent on the number of shoppers:

Then, for each shopper operation, T is solved for a given number of shoppers multiplied by the Shopper profile frequency (T = n × f). Solving the equation for 300 shoppers, we can use the T values for each operation as shown in Table 6:

Which becomes:

Therefore:
P = min [116.95,160] = 116.95 PPEM
Based on this calculation, the CPU cost for 300 concurrent shoppers is approximately 117 PPEMs. In other words, for this shopper community of 10,000 users, a 1-processor SSCE server will show a CPU utilization of 58.5 percent (117 PPEM) at a peak load of 300 concurrent shoppers.
To determine the CPU cost of each shopper operation in the Volcano Coffee store, the InetMonitor simulator is used to run scripts to simulate load for each operation. To ensure that CPU cost reflects optimal achievable rate, user load is gradually increased until capacity is reached. Then, in order to minimize the impact of context switching on CPU resources, measurements that show more than 15,000 context switches are discarded when possible. Once the optimal rate has been identified, CPU utilization is converted to PPEM. Then CPU cost per shopper operation is obtained by dividing the PPEM by the number of operations per second.
Table 7: CPU Utilization for the Search Operation on 4-processor SSCE
| InetMonitor User Load11 | 3 | 6 | 9 | 12 | 15 |
| % CPU utilization | 13.949 | 15.137 | 23.634 | 29.503 | 30.332 |
| ASP requests/sec | 6.228 | 6.037 | 6.948 | 7.543 | 7.555 |
| ASP requests executing | 1.237 | 1.840 | 3.298 | 4.122 | 5.435 |
| ASP execution time (ms) | 206 | 301 | 604 | 573 | 1,000 |
| Context switches | 2,675 | 4,144 | 10,425 | 14,202 | 15,759 |
| Disk I/O (SQL Server) | 4.93 | 5.48 | 5.93 | 6.17 | 4.77 |
| SQL I/O transactions/sec | 26.83 | 28.65 | 30.30 | 31.53 | 30.73 |
11. InetMonitor load is based on a constant load of n users using the InetMonitor tool. An InetMonitor user sends a constant stream of ASP requests (unlike a shopper as described in the Shopper Profile).
The previous table shows sample data collected for the search operation. Based on this data, ASP throughput for the search operation peaks when load=15 (ASP requests per second is 7.555 and CPU is 30.332 percent utilization). Using these measurements, CPU cost for a single search operation can be calculated in terms of PPEMs:
(30.332 percent CPU utilization) × (200 MHz) × (4 processors) = 242.66 PPEM
Cost = (242.66 PPEMs) / (7.555 ASP requests/sec) = 32.12 PPEMs per ASP request (or operation. For the search operation, one ASP request equals one shopper operation.)
To ensure the accuracy of the calculated CPU costs, a final test is run with a mix of shopper operations. Then the results of the test are compared with the calculated results (in Chapter 2). The testing tool for this verification test is the InetMonitor simulator.
A test script is written to simulate typical shopper behavior as described by the Shopper Profile. In essence, the verification script will generate (on average) 19.0 operations for a single shopper over a 20-minute session. If the Shopper Profile is an accurate profile of true shopper behavior, this verification script should provide very good information regarding actual capacity (in terms of concurrent VC shoppers) for this SSCE server.
Note See Appendix F for Verification Test Script.
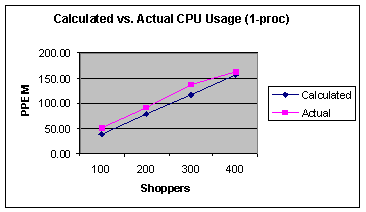
Following is a graph that shows test results versus calculated results for a 1-processor SSCE server. Note that test results start to flatten as CPU utilization approaches 80 percent (160 PPEM). This flattening correlates with a slowing in the increase of ASP throughput. At higher shopper loads, CPU utilization and ASP throughput will start to fall, indicating capacity has been reached.
Chart 6: Actual versus Calculated CPU Usage for 1-processor SSCE
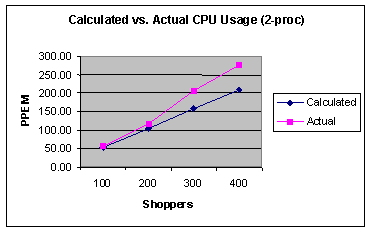
The same tests were performed on a 2-processor SSCE server to confirm how VC scales from one to two processors. Actual costs start increasing above calculated projections as shopper load hits 300 users (in a fairly linear manner).
Chart 7: Actual versus Calculated CPU Usage for 2-processor SSCE
Finally, verification tests were performed on a 4-processor SSCE server. Once again, as load increases, CPU costs start rising faster than projections, this time in a predictable curve.
Chart 8: Actual versus Calculated CPU Usage for 4-processor SSCE
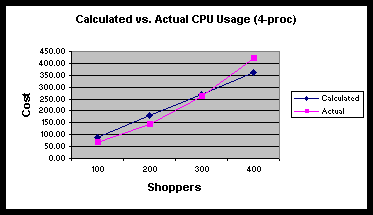
Table 8: Verification Test Data for 1-processor, 2-processor, and 4-processor SSCE
| 1-processor | |||||
| Users | 100 | 200 | 300 | 400 | 500 |
| %proc | 25.741 | 45.604 | 67.904 | 81.124 | 87.499 |
| Req/sec | 1.970 | 3.833 | 5.252 | 6.112 | 6.456 |
| Req exec | 0.483 | 1.021 | 2.886 | 5.010 | 6.510 |
| Context | 980 | 1,575 | 1,966 | 2,267 | 2,668 |
| Req exec time (ms) | 175 | 215 | 373 | 603 | 724 |
| Req wait time (ms) | 0.000 | 0.330 | 19.367 | 120.930 | 435.460 |
| Reqs queued | 0.000 | 0.000 | 0.076 | 0.780+ | 3.180 |
| SQL Server Disk | 8.950 | 14.810 | 15.092 | 18.700 | 18.960 |
| SQL Server I/O | 52.721 | 103.801 | 143.856 | 162.733 | 171.884 |
| CPU Cost (PPEM) | 26.133 | 23.795 | 25.858 | 26.546 | 27.106 |
| SQL Server Cost | 26.762 | 27.081 | 27.391 | 26.625 | 26.624 |
| 2-processor | |||||
| Users | 100 | 200 | 300 | 400 | 450 |
| %proc | 14.298 | 29.491 | 51.281 | 69.250 | 73.656 |
| Req/sec | 1.910 | 3.760 | 5.241 | 5.877 | 6.178 |
| Req exec | 0.420 | 1.020 | 3.610 | 7.180 | 8.390 |
| Context | 1,333 | 3,526 | 10,424 | 19,213 | 21,026 |
| Req exec time (ms) | 168 | 295 | 504 | 1,008 | 1,357 |
| Req wait time (ms) | 0 | 2 | 2 | 112 | 449 |
| Reqs queued | 0.000 | 0.010 | 0.020 | 0.280 | 0.150 |
| SQL Server disk | 10.431 | 13.475 | 17.125 | 17.629 | 17.304 |
| SQL Server I/O | 52.346 | 101.687 | 140.265 | 157.530 | 169.044 |
| CPU Cost (PPEM) | 29.943 | 31.373 | 39.138 | 47.133 | 47.689 |
| SQL Server Cost | 27.406 | 27.044 | 26.763 | 26.804 | 27.362 |
| 4-processor | |||||
| Users | 100 | 200 | 300 | 400 | 500 |
| %proc | 8.443 | 17.773 | 32.793 | 52.318 | 61.742 |
| Req/sec | 1.982 | 3.841 | 4.891 | 5.282 | 4.871 |
| Req exec | 0.367 | 1.364 | 4.470 | 10.000 | 17.667 |
| Context | 1,605 | 4,136 | 11,643 | 24,011 | 32,061 |
| Req exec time (ms) | 147 | 281 | 736 | 1578 | 3112 |
| Req wait time (ms) | 0 | 0 | 2 | 5 | 1212 |
| Reqs queued | 0.000 | 0.000 | 0.010 | 0.020 | 3.452 |
| SQL Server disk | 8.407 | 14.982 | 14.946 | 16.128 | 17.881 |
| SQL Server I/O | 52.281 | 101.305 | 137.454 | 146.893 | 127.321 |
| CPU Cost (PPEM) | 34.079 | 37.017 | 53.638 | 79.240 | 101.403 |
| SQL Server Cost | 26.378 | 26.375 | 28.103 | 27.810 | 26.139 |
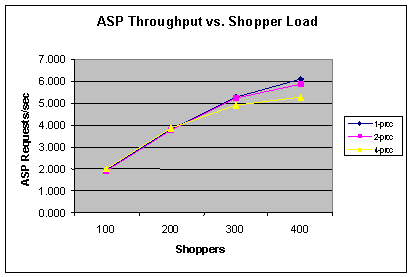
In the following chart, ASP throughput is compared for 1-processor, 2-processor, and 4-processor configurations. In all three configurations, the trend is very nearly linear at lower shopper loads (2.0 ASP requests per 100 users). As load increases, all three configurations show a fall-off in throughput rate with 4-processor showing the greatest falloff and 1-processor showing the least (by a small margin).
Chart 9: ASP Throughput for 1-processor, 2-processor, and 4-processor SSCE
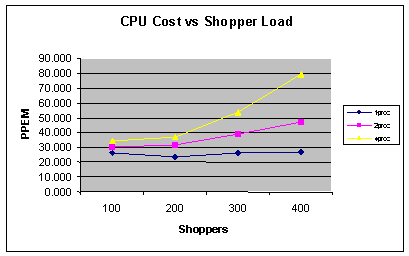
Now, CPU cost is compared for the same three configurations. Ideally, cost should not change as shopper load increases. Note that CPU cost for a 1-processor SSCE is essentially constant while cost on 2-processor and 4-processor SSCE servers grows geometrically. The best explanation for increased cost on 2-processor and 4-processor servers is the extra CPU cycles consumed by the rapid growth in context switching.
Chart 10: CPU cost for 1-processor, 2-processor, and 4-processor SSCE
Context switching is defined as the rate at which one thread is switched to another (either within a process or across processes). Context switching occurs when one thread is preempted by another higher-priority thread, or one thread requests information from another thread. On 2-processor and 4-processor SSCE servers, context switching is far more pronounced than on 1-processor SSCE servers, and this may help explain why better performance is not achieved on multi-processor configurations.
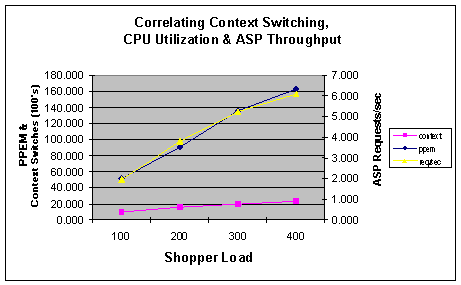
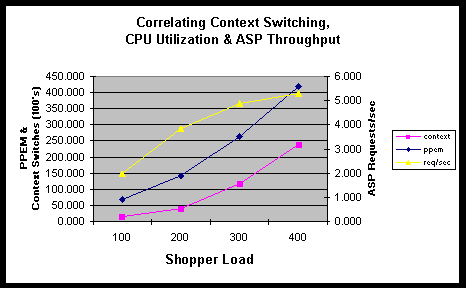
In the next three charts, context switching is charted against ASP throughput and CPU utilization for 1-processor, 2-processor and 4-processor configurations. The purpose of these charts is to show how context switching and ASP throughput correlate with CPU utilization. You will notice that when context switching is low, CPU utilization correlates very closely with ASP throughput. However, when context switching is high, CPU utilization correlates more closely with context switching.
In the following chart, context switching is relatively low, peaking at 2668/sec on a 1-processor SSCE server. ASP throughput is almost perfectly correlated with CPU utilization. This suggests that CPU cycles are used almost entirely to service ASP requests. The fall-off in ASP throughput at higher shopper loads is in all probability due to CPU approaching capacity.
Chart 11: Context Switching for 1-processor SSCE
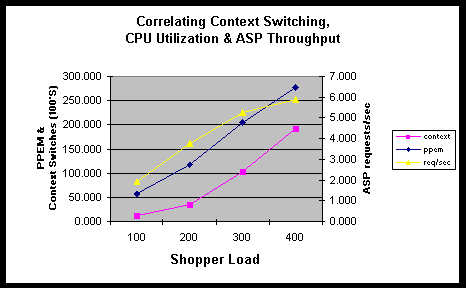
In this next chart, context switching rises far more rapidly with increased shopper load, peaking at 19,213/sec (which is well above the threshold of 15,000/sec discussed earlier). Note that CPU utilization is now more closely correlated with context switching than with ASP throughput. The ASP performance rate starts to fall at 400 shoppers, while context switching and CPU utilization continue to climb. This fact suggests that context switching is now having a greater impact on CPU utilization.
Note Note that the most dramatic fall-off in ASP throughput occurs when context switching passes the 15,000/sec threshold. When shopper load is 300, context switching is below the threshold at 10,424 and ASP throughput is still fairly linear.
Chart 12: Context Switching for 2-processor SSCE
In the final chart, CPU utilization and context switching show the same close correlation seen in the previous chart for 2-processor SSCE. The drop in ASP throughput rate and the rises in context switching and CPU utilization, however, are more pronounced. In this chart, context switching has climbed to 24,011 switches/sec.
Chart 13: Context Switching for 4-processor SSCE
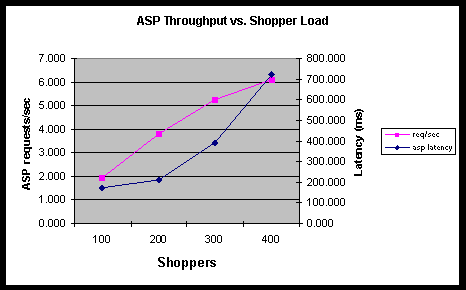
The next chart demonstrates how ASP throughput and ASP latency change with increased shopper load on a 1-processor SSCE server. Note that between 100 and 200 shoppers, ASP throughput is almost perfectly linear. But as throughput approaches capacity, the linear relationship begins to break down and latency increases rapidly. At 100 shoppers, the time required to process an ASP is 0.175 seconds. This number increases to 0.724 seconds at peak load (400 shoppers), when ASP throughput is 6.112 requests/sec. If load is increased beyond 400 shoppers, ASP latency continues to increase geometrically (as would be expected), while ASP throughput flattens, then starts to drop.
Chart 14: ASP Throughput and ASP Latency for 1-processor SSCE
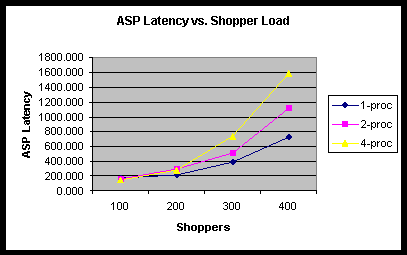
In this final chart, ASP latency is compared for 1-processor, 2-processor and 4-processor SSCE servers. ASP latency on a 4-processor server is approximately twice the latency of a 1-processor server. Longer latency periods translate to slower response time for shopper operations.
Chart 15: ASP Latency for 1-processor, 2-processor, and 4-processor SSCE
Using the methodology shown in Chapter 2 for 1-processor SSCE, cost equations can be created for 2-processor and 4-processor servers. CPU costs for each shopper operation are measured for 2-processor and 4-processor SSCE configurations. These values are then plugged into the CPU cost calculation (Chapter 2) to produce a value for total cost for a given number of shoppers.
The following table shows CPU costs for each VC shopper operation using a 2-processor SSCE configuration.
Table 9: CPU Cost for VC Operations using 2-processor SSCE
| VC Shopper Operation | Ops/sec | %CPU | PPEM Cost |
| Additem (AI) | 3.394 | 60.260% | 71.015 |
| Basket (B) | 6.735 | 65.482% | 38.891 |
| Checkout (C)12 | 1.008 | 42.330% | 152.964 |
| Clearitems (CI) | 5.787 | 54.174% | 37.445 |
| Default (D) | 28.577 | 42.399% | 5.935 |
| Delitem (DI) | 4.577 | 54.622% | 47.732 |
| Listing (PL) | 5.124 | 60.070% | 46.893 |
| Lookup (SL) | 11.469 | 41.932% | 14.624 |
| New (NS) | 10.222 | 45.553% | 17.825 |
| Main (MD) | 5.521 | 56.829% | 41.173 |
| Product (PB) | 9.844 | 53.747% | 21.839 |
| Search (PS) | 9.828 | 52.246% | 21.264 |
| Welcome (W) | 35.563 | 49.806% | 5.602 |
12. Because checkout uses 3 ASPs, ops/sec is equal to 1/3 of ASP throughput, and CPU cost is the sum of the costs of each of the 3 ASPs.
Plugging the PPEM costs from Table 9 into the Processor Calculation (as found in Chapter 2), we get the following formula:

Then, calculating total cost for a given number of shoppers requires adding the weights to the PPEM costs for each VC operation. Weights are determined by multiplying frequency by number of shoppers (T = n ´ f). To solve the equation for 300 shoppers, we can use the T values listed in Table 6:

Solving for P, you get:
P = min [157.37,220] = 157.37 PPEM (for 300 users on a 2-processor SSCE server)
Note that P is bounded by a maximum value of 220 (220 PPEM or 55 percent CPU utilization), which is the maximum observed CPU utilization in verification testing.
The 4-processor cost calculations are shown in the following table:
Table 10: CPU cost for VC operations using 4-processor SSCE
| VC Shopper Operation | ASP ops/sec | %CPU | PPEM Cost |
| Additem (AI) | 3.171 | 27.038% | 68.209 |
| Basket (B) | 7.886 | 31.634% | 32.091 |
| Checkout (C) | 1.185 | 27.273% | 177.355 |
| Clearitems (CI) | 6.580 | 32.242% | 39.200 |
| Default (D) | 28.895 | 20.307% | 5.622 |
| Delitem (DI) | 4.098 | 28.658% | 55.951 |
| Listing (PL) | 3.272 | 26.388% | 64.518 |
| Lookup (SL) | 10.988 | 23.600% | 17.182 |
| New (NS) | 9.722 | 25.441% | 20.935 |
| Main (MD) | 4.414 | 36.581% | 66.300 |
| Product (PB) | 3.305 | 33.483% | 81.048 |
| Search (PS) | 7.555 | 30.332% | 32.119 |
| Welcome (W) | 32.523 | 25.491% | 6.270 |
Plugging the PPEM costs from Table 10 into the Processor Calculation (as found in Chapter 2), we get the following formula:

Then, inserting the T values (found in Table 6) to project cost for 300 users, we get the following:

So: P = min [270.09,440] = 270.09 PPEM (for 300 users on a 4-processor SSCE server)
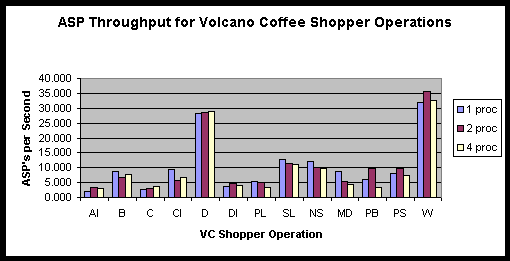
The following charts evaluate performance characteristics of individual shopper operations within the VC store. These results were created by pushing load to capacity (for each operation) using the InetMonitor simulator.
Chart 16 shows ASP throughput for SSCE servers running with one, two and four processors. Taller bars indicate greater performance. What this shows is no improvement in ASP performance for 2-processor and 4-processor SSCE servers.
Chart 16: ASP Performance on 1-processor, 2-processor, and 4-processor SSCE Servers
In Chart 17, CPU costs (PPEMs per shopper operation) are compared. Taller bars indicate greater cost (more PPEMs required to execute a single operation). Ideally, CPU cost should remain constant across all processor configurations.
Chart 17: CPU Cost for 1-processor, 2-processor, and 4-processor SSCE Servers
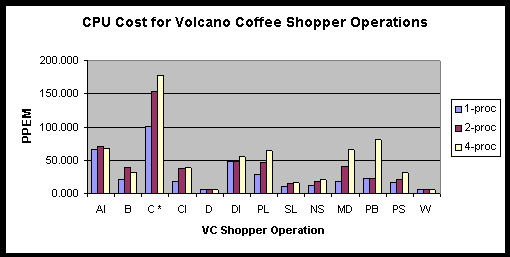
Note The checkout operation is made up of 3 separate ASPs, which triples CPU cost for this shopper operation (operation cost is the sum of ASP costs).
All counters noted can be found in the PerfMon performance monitor. The SSCE-related counters in the ASP and HTTP objects can be used to capture profile information, as well as usage trends. The counters in the system and memory objects can be used to monitor capacity.
Requests executing
Request execution time
Request wait time
Requests queued
Private Bytesmonitor memory usage
Virtual Bytesmonitor memory usage
Working Setmonitor memory usage
Available Bytesshould be greater than 4 MB
Disk transfers/sec
I/O transactions/sec
Context switches/secshould be less than 15,000
%Total Processor
Total connections
The following lists the test scripts used to calculate optimal load for each Volcano Coffee operation. These scripts are run using the InetMonitor simulator.
REM +++ Login +++
POST SEQULIST(Vc_old1.txt)
REM +++ Add to Basket +++
LOOP 5
 POST RANDLIST(vc_addproduct.txt)
ENDLOOP
REM +++ Login +++
POST SEQULIST(Vc_old1.txt)
REM +++ View Basket +++
LOOP 1000
 GET url:/vc30/basket.asp
ENDLOOP
REM +++ Login +++
POST SEQULIST(Vc_old1.txt)
REM +++ Add & Purchase Product +++
LOOP 5
 POST RANDLIST(vc_addproduct.txt)
 GET url:/vc30/checkout-ship.asp
 POST url:/vc30/xt_orderform_prepare.asp?PROPERTIES:goto=checkout-pay.asp
  &use_form=1&ship_to_country=USA&ship_to_name=spam&ship_to_street=5+5th+St
  &ship_to_city=Seattle&ship_to_state=WA&ship_to_zip=98195&ship_to_phone=2065431000
 POST url:/vc30/xt_orderform_purchase.asp?PROPERTIES:goto=confirmed.asp
  &error=error.asp&bill_to_name=spam&bill_to_street=5+5th+St&bill_to_city=Seattle
  &bill_to_state=WA&bill_to_zip=98195&bill_to_country=USA&bill_to_phone=2065431000
  &bill_to_email=spam&cc_name=spam&cc_type=Visa&_cc_number=4111111111111111
  &_cc_expmonth=12&_cc_expyear=1998
ENDLOOP
REM +++ Login +++
POST SEQULIST(Vc_old1.txt)
REM +++ Remove Product +++
POST url:/vc30/xt_orderform_clearitems.asp
REM +++ Start Page +++
GET url:/vc30/default.asp
REM +++ Login +++
POST SEQULIST(Vc_old1.txt)
REM +++ Remove Product +++
LOOP 5
 GET url:/vc30/xt_orderform_delitem.asp
ENDLOOP
REM +++ Login +++
POST SEQULIST(Vc_old1.txt)
REM +++ Get Product Listing +++
LOOP 1000
 GET url:/vc30/listing.asp
ENDLOOP
REM +++ New Shopper +++
POST SEQULIST(Vc_old1.txt)
REM +++ New Shopper +++
POST SEQULIST(Vc_old1.txt)
REM +++ Login +++
POST SEQULIST(Vc_old1.txt)
REM +++ Directory of Product Departments +++
LOOP 1000
 GET url:/vc30/main.asp
ENDLOOP
REM +++ Login +++
POST SEQULIST(Vc_old1.txt)
REM +++ Get Product +++
LOOP 1000
 GET RANDLIST(vc_product.txt)
ENDLOOP
REM +++ Login +++
POST SEQULIST(Vc_old1.txt)
REM +++ Post Search Results +++
LOOP 1000
 POST url:/vc30/srchresult.asp?PROPERTIES:str=chocolate
ENDLOOP
REM +++ Welcome New Shopper +++
get url:/vc30/welcome_new.asp
The InetMonitor scripts reference the following InetMonitor lookup tables.
ShopperManager%2Fvc30
url:/vc30/xt_shopper_new.asp?PROPERTIES:country=USA&name=New&street=4+4th
 &city=Seattle&state=WA&zip=98100&phone=206-543-1200&email=1001&pwd1=pass
&pwd2=pass
url:/vc30/xt_shopper_new.asp?PROPERTIES:country=USA&name=New&street=4+4th
 &city=Seattle&state=WA&zip=98100&phone=206-543-1200&email=1002&pwd1=pass
&pwd2=pass
url:/vc30/xt_shopper_new.asp?PROPERTIES:country=USA&name=New&street=4+4th
 &city=Seattle&state=WA&zip=98100&phone=206-543-1200&email=1003&pwd1=pass
&pwd2=pass
. . .
url:/vc30/xt_shopper_lookup.asp?PROPERTIES:shopper_email=1 &shopper_password=pass
url:/vc30/xt_shopper_lookup.asp?PROPERTIES:shopper_email=2
 &shopper_password=pass
url:/vc30/xt_shopper_lookup.asp?PROPERTIES:shopper_email=3
 &shopper_password=pass
. . .
url:/vc30/xt_orderform_additem.asp?PROPERTIES:pfid=1
 &name=Ethiopian+Supremo&quantity=1
url:/vc30/xt_orderform_additem.asp?PROPERTIES:pfid=2
 &name=Majestic+Mountain+Blend&quantity=1
url:/vc30/xt_orderform_additem.asp?PROPERTIES:pfid=3
 &name=Mezzana+Blend&quantity=1
. . .
url:/vc30/product.asp?dept%5Fid=1&pindex=1
url:/vc30/product.asp?dept%5Fid=1&pindex=2
url:/vc30/product.asp?dept%5Fid=1&pindex=3
url:/vc30/product.asp?dept%5Fid=1&pindex=4
url:/vc30/product.asp?dept%5Fid=2&pindex=1
url:/vc30/product.asp?dept%5Fid=2&pindex=2
. . .
REM +++ Start Page +++
 GET url:/vc30/default.asp
 SLEEP RANDNUMBER(10000,110000)

REM +++ Old Shopper Login +++
 POST SEQULIST(Vc_old1.txt)
 SLEEP RANDNUMBER(10000,110000)
 GET url:/vc30/welcome_lookup.asp
 SLEEP RANDNUMBER(10000,110000)

REM +++ Search for Product +++
LOOP 2
 POST url:/vc30/srchresult.asp?PROPERTIES:str=chocolate
 SLEEP RANDNUMBER(10000,110000)
ENDLOOP

REM +++ Browse Product +++
LOOP 3
  GET RANDLIST(vc_product.txt)
  SLEEP RANDNUMBER(10000,110000)
ENDLOOP

REM +++ Add item & Purchase +++
%50 SKIP 8
 POST RANDLIST(vc_addproduct.txt)
 SLEEP RANDNUMBER(10000,110000)
 GET url:/vc30/checkout-ship.asp
 SLEEP RANDNUMBER(10000,110000)
 POST url:/vc30/xt_orderform_prepare.asp?PROPERTIES:goto=checkout-pay.asp
  &use_form=1&ship_to_country=USA&ship_to_name=spam&ship_to_street=5+5th+St
  &ship_to_city=Seattle&ship_to_state=WA&ship_to_zip=98195
  &ship_to_phone=20654310000
 SLEEP RANDNUMBER(10000,110000)
 POST url:/vc30/xt_orderform_purchase.asp?PROPERTIES:goto=confirmed.asp
  &error=error.asp&bill_to_name=spam&bill_to_street=5+5th+St&bill_to_city=Seattle
  &bill_to_state=WA&bill_to_zip=98195&bill_to_country=USA
  &bill_to_phone=20654310000&bill_to_email=spam&cc_name=spam&cc_type=Visa
  &_cc_number=4111111111111111&_cc_expmonth=12&_cc_expyear=1998
 SLEEP RANDNUMBER(10000,110000)

REM +++ View Basket +++
LOOP 2
 GET url:/vc30/basket.asp
 SLEEP RANDNUMBER(10000,110000)
ENDLOOP

REM +++ Add then Remove Item from Basket +++
%50 SKIP 4
 POST RANDLIST(vc_addproduct.txt)
 SLEEP RANDNUMBER(10000,110000)
 GET url:/vc30/xt_orderform_delitem.asp
 SLEEP RANDNUMBER(10000,110000)

REM +++ Add then Empty Basket +++
%50 SKIP 4
 POST RANDLIST(vc_addproduct.txt)
 SLEEP RANDNUMBER(10000,110000)
 GET url:/vc30/xt_orderform_clearitems.asp
 SLEEP RANDNUMBER(10000,110000)

REM +++ Browse Product +++
LOOP 3
  GET RANDLIST(vc_product.txt)
  SLEEP RANDNUMBER(10000,110000)
ENDLOOP

REM +++ Go to Main Directory Area +++
LOOP 2
 GET url:/vc30/main.asp
 SLEEP RANDNUMBER(10000,110000)
ENDLOOP

REM +++ Go to Main Directory Area & Display List of Products +++
%50 SKIP 2
 GET url:/vc30/main.asp
 SLEEP RANDNUMBER(10000,110000)
 GET url:/vc30/listing.asp
 SLEEP RANDNUMBER(10000,110000)
Information in this document, including URL and other Internet web site references, is subject to change without notice. The entire risk of the use or the results of the use of this resource kit remains with the user. This resource kit is not supported and is provided as is without warranty of any kind, either express or implied. The example companies, organizations, products, people and events depicted herein are fictitious. No association with any real company, organization, product, person or event is intended or should be inferred. Complying with all applicable copyright laws is the responsibility of the user. Without limiting the rights under copyright, no part of this document may be reproduced, stored in or introduced into a retrieval system, or transmitted in any form or by any means (electronic, mechanical, photocopying, recording, or otherwise), or for any purpose, without the express written permission of Microsoft Corporation.
Microsoft may have patents, patent applications, trademarks, copyrights, or other intellectual property rights covering subject matter in this document. Except as expressly provided in any written license agreement from Microsoft, the furnishing of this document does not give you any license to these patents, trademarks, copyrights, or other intellectual property.
© 1999-2000 Microsoft Corporation. All rights reserved.
Microsoft, MSN, Windows and Windows NT are either registered trademarks or trademarks of Microsoft Corporation in the U.S.A. and/or other countries/regions.
The names of actual companies and products mentioned herein may be the trademarks of their respective owners.