

This document evaluates the performance and scalability characteristics of the Microsoft® Site Server version 3.0 Dynamic Directory as it is used to support Microsoft® NetMeeting™ version 2.x clients. Also provided is a methodology for making decisions about capacity planning. Using the procedures outlined in this document, you can pinpoint how user load impacts hardware resources, and which resources are likely to be bottlenecks in performance. It is then possible to calculate capacity (maximum number of NetMeeting users) for a particular hardware configuration, and to ascertain which resources can be added to satisfy greater capacity needs.
The first step in analyzing the NetMeeting performance is to break it down into individual components. Each component is referred to as an operation, and each operation is equivalent to a command using the Lightweight Directory Access Protocol (LDAP). For example, when a NetMeeting user requests a directory listing of all NetMeeting users connected to a Dynamic Directory computer, this request is equivalent to the LDAP Search command.
Once all the components of the service have been identified, a user profile can be created to approximate the behavior of an average NetMeeting user visiting this site. A user profile simulates the mix of operations executed during a single visit by a NetMeeting user.
The performance of each operation can be accurately measured using the InetMonitor simulator. When testing performance of an operation, user load is gradually increased on the Dynamic Directory computer until optimal performance is achieved. At this point, measurements are taken for each hardware resource, including CPU, disk, network, and memory.
Note Performance is defined in terms of transactions per second. Increased transactions per second equate higher performance. Optimal performance is defined as maximum performance with minimum cost.
Resource cost for a NetMeeting operation is calculated by dividing resource usage by the optimum performance rate. For example, consider an operation that has an optimal performance rate of 100 transactions per second with 20 percent CPU utilization on a 1-processor 200-MHz Pentium Pro computer. Using Pentium Pro Equivalent Megahertz (PPEM) as the unit of cost, 100 transactions/sec generates 40 PPEM. Therefore, the cost of a single NetMeeting operation is 0.40 PPEM.
Table 1: Calculating cost per transaction (in PPEM)
| 10 transaction/sec | Generates | 20% CPU usage |
| 20% CPU usage | Equals | 40 PPEM |
| Resource cost | Equals | 40 PPEM/(100 operation/sec) |
| Resource cost | Equals | 0.40 PPEM per transaction/sec |
Once the cost of each NetMeeting operation has been determined, equations can be designed that are used to project total resource cost for any number of NetMeeting users. The fundamental equation used to solve for the total cost to a resource is:
C = n × K
where C is resource cost, n = number of concurrent users, and K is the sum of the costs of operations. Using these equations, it is possible to intelligently predict the maximum number of users a particular hardware configuration can support, or conversely, the hardware resources required for a given number of users.
The accuracy of these calculations is confirmed by comparing the results of the calculations with a series of verification tests. A test script is created which simulates user behavior defined in the user profile; then predicted resource costs calculated from the model are charted against actual resource costs generated by running the verification script.
Scaling shows how well this service performs on single processor, dual processor and quad processor computer. In order to determine the benefits of scaling, the performance characteristics (throughput and resource cost) for each hardware resource are compared. If, for example, it is determined that this service is processor-bound, how will increasing the number of processors increase capacity? Ideally, increasing the number of processors on the server will increase throughput without any change in resource cost. And, as a consequence of this increase in throughput, user capacity will also increase.
The Dynamic Directory computer used in these verification tests is configured in the following manner:
| CPU: | 1 x 200-MHz Pentium Pro |
| Memory: | 384 MB of RAM |
| Disk: | 1 x 4.3-GB SCSI |
| Volumes: | C: (4.0-GB NTFS) |
| Network: | Intel EtherExpress Pro/100+ on 100 MB switched Ethernet |
| Software: | Microsoft® Internet Information Server version 4.0, Site Server version 3.0 |
Note The Dynamic Directory computer is a 1 x 200 Pentium Pro computer (1-processor). However, where noted, 2-processor and 4-processor configurations are also used, primarily for discussions of scalability.
The Microsoft® Site Server version 3.0 Dynamic Directory is used to organize directory information for Internet clients. The primary application of the Dynamic Directory is NetMeeting™, which is an integrated voice and video conferencing service that also includes shared whiteboard, text-based chat, and file transfer capabilities for NetMeeting users. NetMeeting users connected to a Dynamic Directory server contact and communicate with each other by using directory information provided by the server.
Users gain access to the Dynamic Directory using the Lightweight Directory Access Protocol (LDAP) version 2, which is a standard Internet protocol for directory services (RFC 1777). LDAP directory information can be stored on disk using a Microsoft® SQL Server™ database (Static Directory) or stored in a memory resident database (Dynamic Directory). NetMeeting is ideally suited to the Dynamic Directory because memory resident databases offer superior performance, and the size of a NetMeeting user database is well within the memory capacity of a typically-configured Microsoft® Windows NT® Server.
Chart 1: Client/Server structure of Dynamic Directory with NetMeeting client

NetMeeting operations can be divided into two categories: those that use IRC (Internet Relay Chat) and those that use Lightweight Directory Access Protocol (LDAP). Operations that use the IRC protocol do not utilize the Dynamic Directory and are therefore not considered in this document. There are four NetMeeting operations that translate into LDAP commands used to interact with the Dynamic Directory. These commands are listed in the NetMeeting Profile found in Table 2. The purpose of the NetMeeting Profile is to define the number of times each of these four NetMeeting operations is performed during an average NetMeeting session, as well as define the average length of a session.
Note also in the NetMeeting Profile that transactions per session is converted to transactions per second, which, in this document, is referred to as the frequency of this operation. This frequency value is used later to calculate resource cost for each NetMeeting operation.
Table 2: NetMeeting user profile
| NetMeeting operation | LDAP command | Transactions/session | Frequency1 |
| Connect | Add | 1 | 0.000556/sec |
| Change User Information | Modify | 4 | 0.002222/sec |
| Directory Listing | Search/Dir2 | 4 | 0.002222/sec |
| Disconnect | Delete | 1 | 0.000556/sec |
| 30-minute session | --- | 10 transactions | 0.005556/sec |
1. Transactions per second.
2. Within the LDAP protocol, the Search command can be used to retrieve the entire list of users in the Dynamic Directory or some subset of the total list. In the case of the NetMeeting client, the Search command is used exclusively for retrieving a complete directory listing from the Dynamic Directory. In order to distinguish Search in the context of NetMeeting, this command will be referred to as Search Directory, or more succinctly, Search/Dir.
Based on data collected in this document, the following assertions can be made about scaling and performance:
Resource cost for Search/Dir is far greater than the resource cost for all other operations combined. Because of this, it is possible to project user capacity based solely on the performance characteristics of Search/Dir.
Table 3 compares maximum throughput for Search/Dir on 1-processor, 2-processor and 4-processor computers. Note that for all processor configurations, transaction throughput decreases as the number of NetMeeting users increases.
Maximum throughput for Search/Dir on each processor configuration is also compared with the projected throughput requirement (PTR) for a given number of NetMeeting users. Projected throughput for Search/Dir is based on the NetMeeting profile outlined in Table 2, which indicates that one NetMeeting user will perform four Search/Dir requests during a 30-minute session.
What the PTR shows is the minimum number of Search/Dir requests that must be processed per second to support a given number of users. As the number of NetMeeting users increases, so does the PTR. If the PTR is greater than the maximum throughput for any processor configuration, then capacity has been exceeded for that configuration.
Table 3: Comparing maximum transaction throughput with projected throughput requirement for Search/Dir
| Users | 1-processor: Maximum throughput3 | 2-processor: Maximum throughput | 4-processor: Maximum throughput | Projected throughput requirement4 |
| 258 | 23.811 | 30.373 | 21.602 | 0.573 |
| 507 | 8.586 | 14.088 | 13.827 | 1.127 |
| 757 | 6.575 | 10.037 | 7.935 | 1.682 |
| 1,008 | 5.431 | 6.522 | 6.639 | 2.240 |
| 1,268 | 4.536 | 5.271 | 5.278 | 2.818 |
| 1,517 | 3.681 | 3.593 | 3.911 | 3.371 |
3. Maximum throughput is the maximum number of Search/Dir requests/sec measured for a given number of Net Meeting users.
4. Using the Search/Dir frequency value of 0.002222 requests/sec found in Table 1, projected throughput requirement is calculated by multiplying this value by the number of NetMeeting users. For example, (258 users × 0.002222) equals a minimum throughput requirement of 0.573 Search/Dir requests/sec.
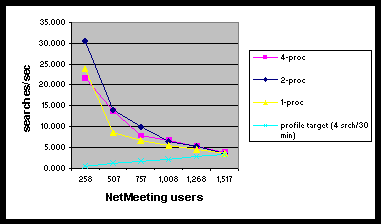
Using Table 3 data, the chart below clearly shows maximum throughput converging with the projected throughput requirement at approximately 1,517 users. Based on this, projected capacity is anticipated to be approximately 1,500 NetMeeting users per computer, for each of the three processor configurations.
Chart 2: Scaling projections for Search/Dir transaction throughput
In this chapter, resource costs are calculated for each Microsoft® NetMeeting™ operation (because the Dynamic Directory is stored entirely in computer memory, disk performance is not a factor for this service). These costs are displayed in Tables 4, 5 and 6. For CPU and network resources, cost is calculated by dividing the resource usage by transactions per second.
Note Memory cost is a special case which is not dependent on transaction rate. Memory cost is based on the number of user connections and the number records in the Dynamic Directory.
Transactions per second is determined by running the InetMonitor test scripts (see Appendix E) and taking measurements that show optimal performance for each user operation. Resource utilization is simply the percent of CPU processing time or amount of network bandwidth being used when throughput is optimal.
Note For 4-processor Dynamic Directory computers, it is not uncommon to see context switching exceed 20,000/sec for high user load. Because context switches consume CPU cycles, processor measurements can be higher than anticipated when context switches are also high. In tests performed for this document, CPU utilization increased noticeably without a correlating increase in transaction throughput when context switches exceeded 15,000. Hence, measurements for peak throughput on 4-processor computers are taken when context switching does not exceed 15,000/sec in order to identify maximum throughput at least cost.
Using the values in the cost tables in conjunction with the frequency values calculated from the NetMeeting Profile (Table 2), resource calculations can be created to project resource costs for any given number of NetMeeting users. These resource costs can be charted and, from the charts, capacity can be easily determined. For a clearer understanding of how total resource cost is calculated, the procedure is demonstrated in a step-wise fashion.
Table 4 shows the cost in PPEM for each NetMeeting operation for a 1-processor Dynamic Directory computer. Note that the cost of the Search/Dir transaction is an order of magnitude greater than the cost for the other transactions. Note also that the transaction cost for Search/Dir is largely dependent on the number of user records in the NetMeeting directory. The more user records in the NetMeeting directory, the greater the CPU cost per Search/Dir request, and the lower the transaction throughput.
Table 4: CPU cost for NetMeeting operations using 1-processor computer
| LDAP transaction | Transactions/sec | %CPU | CPU cost (P)5 |
| Add | 216.734 | 86.612% | 0.799 |
| Delete | 493.589 | 100.00% | 0.405 |
| Modify | 516.330 | 100.00% | 0.387 |
| Search/Dir (258u) | 23.811 | 70.421% | 5.915 |
| Search/Dir (507u) | 8.586 | 51.539% | 12.005 |
| Search/Dir (757u) | 6.575 | 57.605% | 17.522 |
| Search/Dir (1,008u) | 5.431 | 56.562% | 20.829 |
| Search/Dir (1,268u) | 4.536 | 58.691% | 25.878 |
| Search/Dir (1,517u) | 3.681 | 56.384% | 30.635 |
5. PPEM cost per transaction, or PPEM used to generate a single transaction. Therefore, a cost of 1.627 means one transaction requires 1.627 PPEM.
Chart 3 uses Table 4 data to chart CPU cost for the Search/Dir transaction with increasing numbers of NetMeeting users. The chart clearly shows that the relationship between CPU cost and number of users is linear.
Chart 3: CPU cost for Search/Dir using 1-processor computer

Chart 4 uses Table 4 data, and compares maximum transaction throughput for Search/Dir (in transactions per second) with CPU usage for increasing numbers of NetMeeting users. This chart demonstrates that, as the number of NetMeeting users increases, transaction throughput decreases, while CPU usage remains relatively constant. Also evident, maximum throughput is reached when CPU utilization is well below maximum (approximately 50-70 percent), which suggests that Dynamic Directory performance is probably not bound by CPU.
Chart 4: CPU utilization & transaction throughput for a 1-processor computer

Table 5 shows the cost in Kbytes/sec for each NetMeeting operation for a 1-processor Dynamic Directory computer. When a NetMeeting user performs an operation, network traffic is generated between the NetMeeting client and Dynamic Directory computer. Note that, whereas network cost for the Search/Dir transaction increases with the number of users, network throughput is relatively constant (460-600Kbytes/sec), which suggests a potential bottleneck in data throughput.
Note Considering that the system configuration used for these tests included a 100-MB switched Ethernet LAN, a network bottleneck can be ruled out, perhaps in favor of data transfer between memory and Ethernet card.
Table 5: Network cost for NetMeeting operations using 1-processor computer
| LDAP transaction | Trans/sec | Kbytes/sec | Network cost (K)6 |
| Add | 216.734 | 123.608 | 0.570 |
| Delete | 493.589 | 22.700 | 0.046 |
| Modify | 516.330 | 71.120 | 0.138 |
| Search/Dir (258u) | 23.811 | 601.602 | 25.266 |
| Search/Dir (507u) | 8.586 | 461.246 | 53.721 |
| Search/Dir (757u) | 6.575 | 504.422 | 76.718 |
| Search/Dir (1,008u) | 5.431 | 547.805 | 100.866 |
| Search/Dir (1,268u) | 4.536 | 581.244 | 128.140 |
| Search/Dir (1,511u) | 3.681 | 563.027 | 152.955 |
6. Network cost per transaction, or number of Kbytes transmitted between client and server for a single transaction.
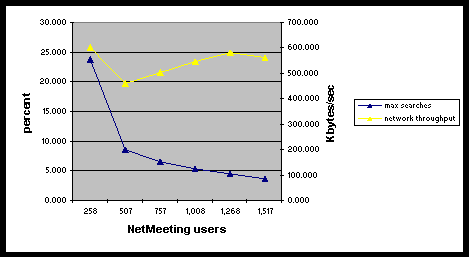
Chart 5 is based on data in Table 5, and compares maximum transaction throughput for Search/Dir (in transactions per second) with data throughput (Kbytes per second) for increasing numbers of NetMeeting users.
On average, maximum throughput is reached at 543 Kbytes/sec. On a 10-MB unswitched Ethernet LAN, this could possibly be seen as a network resource limitation (53 percent utilization). However, these measurements were tested on a 100-MB switched Ethernet (5.3 percent utilization).
Chart 5: Transaction and data throughput for a 1-processor computer
There are two components of memory usage for a Dynamic Directory computer. First, there is a cost associated with the number of directory records in the Dynamic Directory. Second, there is a cost associated with the number of active client connections to the Dynamic Directory computer. As more records are added to the Dynamic Directory and the number of active client connections increases, more memory is consumed.
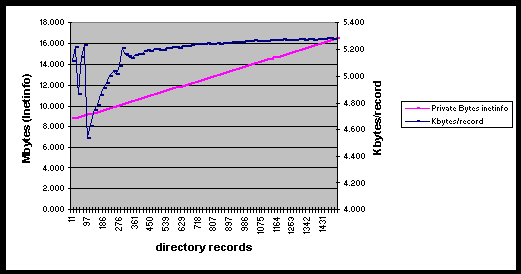
In Chart 6, memory usage is tracked for increasing numbers of user records in the Dynamic Directory.
Note The number of active client connections is held constant at 1.0 to eliminate the cost incurred by increasing the number of connections, which is measured separately.
The average memory cost per user record is also tracked. This chart shows that 1,500 records consume approximately 8 MB of memory, and that the average cost per directory record is 5.275 Kbytes.
Note Each data point represents an average value for kilobytes per record for a given number of directory records. As records increase, the average value levels off at 5.275 Kbytes per record.
Chart 6: Memory cost per record for a 1-processor computer
In Chart 7, average memory cost per connection is tracked for increasing numbers of active client connections for a given number of records. Based on these three different sizes of the Dynamic Directory, the average memory cost per connection is 8.323 Kbytes.
Note Each data point represents an average value for Kbytes per connection for a given number of client connections. As connections increase, the average value levels off at 8.323 Kbytes per connection.
Chart 7: Memory cost per client connection for a 1-processor computer

Using the data from Tables 4, 5, and 6, equations can be designed that are used to project resource cost for a given number of NetMeeting users. The fundamental equation used to solve for the cost of a resource is:
C = n × K
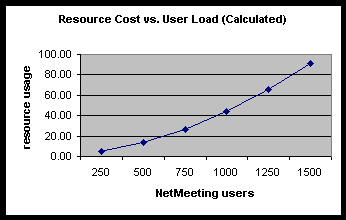
where C is resource cost, n = number of users, and K is the sum of the costs of the NetMeeting operations. Knowing the costs of the NetMeeting operations, total resource cost can be calculated by plugging in a value for NetMeeting users (n). Then a series of data points can be plotted to reflect resource cost for increasing numbers of users, as shown in Chart 8.
Chart 8: Charting total resource cost for an increasing number of NetMeeting users
The NetMeeting Profile in Table 2 is designed to simulate the average behavior of a NetMeeting user. Based on the assumptions made in the profile, frequency values (transactions per second) have been calculated for each NetMeeting operation.
If you know the number of NetMeeting users connecting to the Dynamic Directory computer, you can determine the total operations per second (T) for each operation in the profile. The equation is given by:
T = n × f
where
T= total operations per second
n = number of NetMeeting users
f=frequency (transactions per second per user)
For example, the NetMeeting Profile shows that Search/Dir has a frequency of 0.002222. Plugging this value into the equation, you get:
T = n × 0.002222
If you wanted to find out how many Search/Dir transactions are generated per second for 1,000 concurrent NetMeeting users, the equation can be solved in the following manner:
T = 1000 × 0.002222 = 2.222
Therefore, 1,000 concurrent NetMeeting users will generate 2.222 Search/Dir transactions per second.
Total CPU cost is calculated from the sum of the costs of the individual NetMeeting operations. For operations Add, Delete, Modify, and Search/Dir, total transactions per second for a given number of users (T = n ´ f) is multiplied by the CPU cost (P)(CPU costs for each NetMeeting operation can be found in Table 4.). This is given by the following equation:

where
A= Total Add transactions per second
D= Total Delete transactions per second
M= Total Modify transactions per second
S= Total Search/Dir transactions per second
PS=Cost per Search/Dir transaction
128=Maximum CPU cost (in PPEM) (Based on processor usage measurements shown previously, transaction throughput capacity is reached when CPU utilization reaches, on average, 64 percent—128 PPEM)
Special attention must be given to the cost of a Search/Dir operation because the cost is dependent on the size of the Dynamic Directory. As more records are added to the Dynamic Directory, more data must be transferred to the NetMeeting client, which increases the cost of the operation. Therefore an additional cost must be assigned to the size of the Directory. Using a record as the unit of cost, the cost equation looks like the following:

where
R= Total number of directory records
PR= Cost per record
Before this equation can be solved, cost per Search/Dir operation (PS) and cost per directory record (PR) must be determined.
The record cost component (PR) can be determined by running the Search/Dir operation and tracking PPEM for increasing numbers of records with transaction throughput rate held constant, as shown in the chart below.
Chart 9: CPU cost for Search/Dir transaction on a 1-processor computer

Cost per record is calculated by dividing change in PPEM by change in records:

where
P= PPEM per record
Dp=change in PPEM
Dr=change in number of records
In Table 6, PPEM per record is shown for increasing numbers of records. Based on this table, the average CPU cost per record (PR) is determined to be 0.014942 PPEM.
Table 6: CPU cost per user for Search/Dir transaction on 1-processor computer
| Directory Records | PPEM | Δ Records | ΔPPEM | PPEM per Record |
| 16 | 4.004 | --- | --- | --- |
| 256 | 8.416 | 240 | 4.411 | 0.018381 |
| 495 | 10.967 | 239 | 2.551 | 0.010674 |
| 762 | 15.371 | 267 | 4.404 | 0.016496 |
| 1,010 | 18.546 | 248 | 3.175 | 0.012803 |
| 1,275 | 24.935 | 265 | 6.388 | 0.024107 |
| 1,531 | 26.641 | 256 | 1.706 | 0.006664 |
| Average | --- | 0.014942 |
Transaction cost (PS) can now be determined by taking the cost associated with the records (PR ×R) and then subtracting this from total cost as shown in Table 7. Average CPU cost per transaction (PS) is determined to be 4.145 PPEM per transaction.
Table 7: CPU cost per Search/Dir transaction on a 1-processor computer
| User Records | PPEMTOT | Calculated Dynamic Directory PPEM
(PR ×R) |
Transaction PPEM
PS =PPEMTOT – (PR ×R) |
| 16 | 4.004 | 0.239 | 3.765 |
| 256 | 8.416 | 3.825 | 4.591 |
| 495 | 10.967 | 7.396 | 3.571 |
| 762 | 15.371 | 11.385 | 3.986 |
| 1,010 | 18.546 | 15.091 | 3.455 |
| 1,275 | 24.935 | 19.051 | 5.884 |
| 1,531 | 26.641 | 22.876 | 3.765 |
| Average | --- | --- | 4.145 |
Based on extrapolated values for PS and PR, the final equation becomes:

which can now be solved for number of NetMeeting users (n).
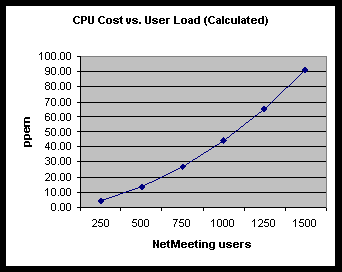
Chart 10 shows the results of solving the processor resource calculation for increasing numbers of NetMeeting users. The number of records (R) is equivalent to the number of NetMeeting users (n). For more information on solving the equation, see the sample calculations in the section titled Sample Site Configuration.
Chart 10: Projected CPU Cost for 1-processor computer
Like the processor calculations, total network cost is calculated from the sum of the costs of the individual NetMeeting operations, with the additional cost associated with Dynamic Directory size for the Search/Dir operation. For operations Add, Delete, Modify, and Search/Dir, total transactions per second for a given number of users (T = n ´ f) is multiplied by the network cost (P). (Network costs for each NetMeeting operation can be found in Table 5.) Then the cost of Search/Dir is shown to increase as the number of records increases (R×PR). This is given by the following equation:

where
A= Total Add transactions per second
D= Total Delete transactions per second
M= Total Modify transactions per second
S= Total Search/Dir transactions per second
R= Total directory records
PR=Cost per directory record
540=Maximum network throughput
In Table 8, cost per directory record (PR) is calculated for different sizes of the Dynamic Directory. Cost is calculated as shown below:
Note Searches per second and bytes transmitted per second are both PerfMon counters (see Appendix E).
PR = (bytes transmitted/sec) ÷ (dynamic searches/sec) ÷ (records)
Table 8: Network usage for Search/Dir transaction on 1-processor computer
| Directory records | Dynamic searches/sec | Bytes transmitted/sec | Bytes /search | Cost per record (PR) |
| 16 | 3.522 | 5,554 | 1,577 | 98.56 |
| 256 | 3.523 | 88,165 | 25,022 | 97.74 |
| 495 | 3.495 | 170,168 | 48,685 | 98.35 |
| 762 | 3.507 | 264,590 | 75,436 | 99.00 |
| 1,010 | 3.477 | 345,401 | 99,328 | 98.34 |
| 1,275 | 3.503 | 442,764 | 126,386 | 99.13 |
| 1,531 | 3.511 | 532,556 | 151,694 | 99.08 |
| Average | --- | --- | --- | 98.61 |
The average cost per record (PR)is determined to be 98.61 bytes (or 0.096 Kbytes). After plugging in the value for PR, the equation becomes:

Chart 11 shows the results of solving the resource calculation for network for increasing numbers of NetMeeting users. The number of records (R) is equivalent to the number of NetMeeting users (n). For information about solving the equation, see the sample calculations in the section titled Sample Site Configuration.
Chart 11: Projected Network Cost for 1-processor computer

Unlike the processor and network calculations, total memory cost is calculated from Dynamic Directory size (number of records) and number of active client connections. This makes projecting memory cost as follows:

where
K= Total memory cost in Kbytes
R= Total records in Dynamic Directory
C= Total user connections
32,768= Base memory (32 MB)
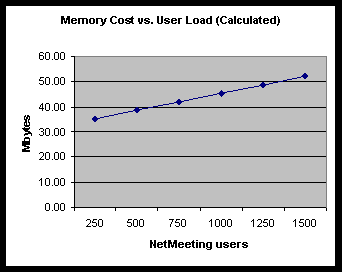
Chart 12 shows the results of solving this equation for increasing numbers of NetMeeting users. In this chart, records (R) and user connections (C) are both equal to the number of NetMeeting users (n).
Chart 12: Projected Memory Cost for 1-processor computer
This example illustrates how to project Site Server version 3.0 Dynamic Directory computer resource requirements for a given community of NetMeeting users. Using the NetMeeting profile outlined in Table 2, the example uses the following information regarding the NetMeeting user community:
100,000 total users
1% online at peak time = 1,000 concurrent users
This information is used to complete the NetMeeting Profile equation for each NetMeeting operation:
T = n ´ f
where
T= Total operations per second
n = Number of NetMeeting users
f=Frequency (transactions per second per user)
In the table below, total operations per second (T) is solved for each NetMeeting operation.
Table 9: Determining T value for each LDAP transaction
| LDAP transaction | n = # NetMeeting users | f= frequency7 | T = total trans/sec |
| Add (A) | 1,000 | 0.000556/sec | 0.556 |
| Delete (D) | 1,000 | 0.000556/sec | 0.556 |
| Modify (M) | 1,000 | 0.002222/sec | 2.222 |
| Search/Dir (S) | 1,000 | 0.002222/sec | 2.222 |
7. Frequency is calculated in the NetMeeting profile table (Table 2).
The equation below was developed in a previous section to determine CPU cost for a given number of users.
Note See the section titled Resource Calculations under the sub-heading Processor.

Solving the equation for 1,000 users, the T values calculated in Table 9 can be plugged in for each operation.

Note that Dynamic Directory size (R) is equal to number of users (n). Therefore:


Based on this calculation, the CPU cost for 1,000 concurrent NetMeeting users is 43.941 PPEM. In other words, for this community of 100,000 users, a 1-processor Dynamic Directory computer will show a CPU utilization of 21.97 percent (43.941 PPEM) at a peak load of 1,000 concurrent NetMeeting users.
To determine the CPU cost for each NetMeeting operation, the InetMonitor simulator is used to run scripts to simulate load for each corresponding Lightweight Directory Access Protocol (LDAP) command. To ensure that CPU cost reflects optimal achievable rate, user load is gradually increased until capacity is reached. Then, in order to minimize the impact of context switching on CPU resources, measurements that show more than 15,000 context switches are discarded when possible.
Table 10 shows sample data collected for the Search/Dir operation. Based on this data, transaction throughput peaks when load=4 (dynamic searches per second is 23.811 and CPU usage is 70.421 percent).
Table 10: CPU utilization for Search/Dir transaction on a 1-processor computer
| InetMonitor User Load8 | 1 | 2 | 3 | 4 | 5 |
| %proc | 51.988 | 41.283 | 58.787 | 70.421 | 35.722 |
| Context switches | 636 | 608 | 603 | 595 | 552 |
| Current Dynamic Directory object | 514 | 514 | 514 | 514 | 514 |
| Dynamic search/sec | 14.114 | 15.571 | 21.269 | 23.811 | 11.146 |
| Bytes rx/sec | 1,862 | 2,055 | 2,806 | 3,142 | 1,467 |
| Bytes tx/sec | 356,594 | 393,424 | 537,381 | 601,598 | 281,414 |
8. InetMonitor load is based on a constant load of n users using the InetMonitor tool. An InetMonitor user sends a constant stream of SEARCH/DIR requests (unlike a user as described in the NetMeeting Profile).
Once the optimal rate has been identified, CPU utilization is converted to PPEM. Then CPU cost per transaction is obtained by dividing the PPEM by the number of transactions per second.
(70.421% CPU usage) × (200 MHz) × (1 processor) = 140.842 PPEM
Cost = (140.842 PPEMs) / (23.811 searches/sec) = 5.915 PPEM per Search/Dir
Therefore, in this example, one Search/Dir operation will cost 5.915 PPEM.
To ensure the accuracy of the calculated CPU costs, a final test is run with a mix of NetMeeting operations based on the NetMeeting Profile. Then the results of the test are compared with the calculated results found in Chapter 2. The testing tool used for this verification is the InetMonitor simulator.
If the NetMeeting Profile is an accurate description of user behavior, this verification script should provide reliable information regarding actual capacity (in terms of concurrent NetMeeting users) for this Site Server version 3.0 Dynamic Directory computer.
Chart 13 shows test results versus calculated results for a 1-processor Dynamic Directory computer.
Chart 13: Actual vs. Calculated CPU usage for 1-processor computer
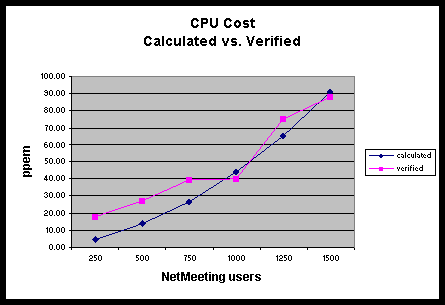
Table 11: Verification Test Data for 1-Processor Computer
| 1-processor | ||||||
| Records | 250 | 500 | 750 | 1,000 | 1,250 | 1,500 |
| % proc | 9.04 | 13.65 | 19.78 | 20.12 | 37.46 | 44.01 |
| Context switch/sec | 333 | 347 | 353 | 390 | 337 | 327 |
| Current dynamic object | 438 | 876 | 1,312 | 1,751 | 2,188 | 2,696 |
| Dynamic add/sec | 0.277 | 0.542 | 0.833 | 1.102 | 1.381 | 1.650 |
| Dynamic delete/sec | 0.278 | 0.552 | 0.834 | 1.116 | 1.378 | 1.522 |
| Dynamic modify/sec | 0.000 | 0.937 | 0.967 | 1.398 | 1.845 | 2.274 |
| Dynamic search/sec | 0.555 | 1.108 | 1.666 | 2.230 | 2.760 | 2.774 |
| Bytes rx/sec | 297 | 588 | 891 | 1,117 | 1,480 | 1,773 |
| Bytes tx/sec | 11,947 | 47,736 | 106,685 | 190,606 | 295,230 | 365,642 |
| Available bytes | 329,599,220 | 326,045,345 | 322,274,196 | 313,811,608 | 315,064,384 | 311,984,500 |
| Private bytes | 12,726,028 | 16,171,008 | 19,536,041 | 22,889,112 | 26,427,136 | 29,957,585 |
| PPEM | 18.09 | 27.30 | 39.57 | 40.23 | 74.93 | 88.02 |
Charts 14 through 18 evaluate performance characteristics of LDAP transactions associated with the four NetMeeting operations. Pushing load to capacity for each operation using the InetMonitor simulator creates these results.
Chart 14 shows transaction throughput for the Add, Modify, and Delete transactions on 1-processor, 2-processor and 4-processor Dynamic Directory computers. Higher bars indicate greater performance.
Chart 14: Transaction throughput for Add, Delete and Modify

In Chart 15, transaction throughput is compared for 1-processor, 2-processor and 4-processor configurations for the Search Directory (Search/Dir) operation with increasing numbers of records. Note that as Dynamic Directory size increases, throughput decreases, and no benefit is achieved by employing a 2-processor or 4-processor computer configuration.
Chart 15: Transaction throughput for 1-processor, 2-processor and 4-processor computers

In Chart 16, CPU cost (PPEM per transaction) is compared for 1-processor, 2-processor and 4-processor configurations using the Search/Dir operation with increasing numbers of records. This chart shows that as Dynamic Directory size increases, cost increases, and that cost is virtually identical across all processor configurations.
Chart 16: CPU Cost for 1-processor, 2-processor and 4-processor computers

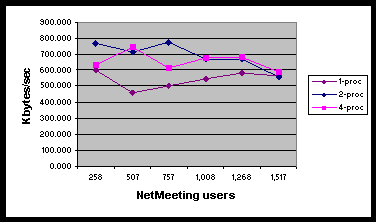
Chart 17 compares network throughput for 1-processor, 2-processor and 4-processor Dynamic Directory computers. For each processor configuration, throughput remains fairly constant as the directory size increases. Recall that for each Search/Dir request, the Dynamic Directory computer sends all records in the directory to the NetMeeting client. Therefore, as the Dynamic Directory size increases, so does the amount of data transmitted per transaction.
Chart 17: Network throughput for 1-processor, 2-processor and 4-processor computers
This final chart shows how network cost increases as the size of the Dynamic Directory increases. Network cost is virtually identical for each processor configuration.
Chart 18: Network cost for 1-processor, 2-processor and 4-processor computers

All counters noted can be found in the PerfMon performance monitor. The LDAP- related counters can be used to capture profile information, as well as usage trends. The counters in the system, memory and process objects can be used to monitor capacity.
Private Bytesmonitor memory usage
Available Bytesshould be greater than 4 MB
Bytes Received/sec
Bytes Sent/sec
Dynamic Add per sec
Dynamic delete per sec
Dynamic Modify per sec
Dynamic Search per sec
Context Switches/secshould be less than 15,000
%Total Processor Time
The following test scripts are used to calculate optimal load for each NetMeeting operation. These scripts are run using the InetMonitor simulator.
CONNECT
BINDSIMPLE ANONYMOUS
LOOP 10
Add DN=cn=sequnumber(1,10000,1)@Microsoft.com,ou=dynamic,
o=Microsoft;givenname=RANDALPHA(6);surname=RANDALPHA(6);
rfc822mailbox=samesequnumber@Microsoft.com;location=redmond;
ipaddress=RANDNUMERIC(10);sflags=1;c=US;securitytoken=RANDNUMERIC(9);
ILSA32833566=2;ILSA32964638=1;ILSA26214430=1;ILSA39321630=2;
objectclass=rtperson\dynamicobject;smodop=3;MimeType=text/iuls;guid=0123456789;
ProtocolMimeType=text/t120\text/h323;port=1503\1720;
SLEEP 100
Add DN=cn=sequnumber(1,10000,2)@Microsoft.com,appname=MSNetMeeting,
ou=applications,o=Microsoft;userobject=cn=samesequnumber@Microsoft.com,
ou=dynamic,o=Microsoft;objectClass=rtapplicationuser\dynamicObject;
applicationID=MS-NetMeeting;MimeType=text/iuls;guid=0123456789;ILSA39321630=2;
protocolid=t120\h323;protocolMimeType=text/t120\text/h323;port=1503\1720;
SLEEP 100
ENDLOOP
QUIT
SLEEP 200
SLEEP 200
CONNECT
SLEEP 200
BINDSIMPLE ANONYMOUS
LOOP 10
Delete cn=randnumber(1,10000)@Microsoft.com,ou=dynamic,o=Microsoft;
ENDLOOP
SLEEP 200
QUIT
SLEEP 200
SLEEP 100
CONNECT
SLEEP 100
BINDSIMPLE ANONYMOUS
LOOP 10
Modify DN=c=US,o=Microsoft,cn=randnumber(1,1500,1)@Microsoft.com,
objectclass=RTPerson; givenname=RANDALPHA(6):R;
ENDLOOP
SLEEP 200
QUIT
SLEEP 200
CONNECT
BINDSIMPLE ANONYMOUS
SEARCH BASE RETURN SUBSET DN=objectClass=RTPerson;
filter=(&(objectClass=RTPerson));
SLEEP 1000
QUIT
For verification testing, the following InetMonitor script is run with a maximum InetMonitor load of 250 users per client computer (to stay within capacity of the client). Verification testing was performed in increments of 250; with each increment a new client machine was added. For testing to work properly, e-mail addresses need to remain unique. So one client computer might use a sequential range from 1 to 10,000 and the next client would use the sequential range from 10,001 to 20,000, and so forth.
CONNECT
BINDSIMPLE ANONYMOUS
SLEEP 90000
Add DN=cn=sequnumber(1,100000,1)@Microsoft.com,ou=dynamic,
o=Microsoft;givenname=RANDALPHA(6);surname=RANDALPHA(6);
rfc822mailbox=samesequnumber@Microsoft.com;location=redmond;
ipaddress=RANDNUMERIC(10);sflags=1;c=US;securitytoken=RANDNUMERIC(9);
ILSA32833566=2;ILSA32964638=1;ILSA26214430=1;ILSA39321630=2;
objectclass=rtperson\dynamicobject;smodop=3;MimeType=text/iuls;
guid=0123456789;ProtocolMimeType=text/t120\text/h323;port=1503\1720;
SLEEP 9000
Add DN=cn=sequnumber(1,100000,2)@Microsoft.com,appname=MSNetMeeting,
ou=applications,o=Microsoft;userobject=cn=samesequnumber@Microsoft.com,
ou=dynamic,o=Microsoft;objectClass=rtapplicationuser\dynamicObject;
applicationID=MS-NetMeeting;MimeType=text/iuls;guid=0123456789;
ILSA39321630=2;protocolid=t120\h323;
protocolMimeType=text/t120\text/h323;port=1503\1720;
SLEEP 9000
Modify DN=c=US,o=Microsoft,cn= randnumber(1,250)@Microsoft.com,
objectclass=RTPerson; givenname=RANDALPHA(6):R;
SLEEP 180000
SEARCH BASE RETURN SUBSET DN=objectClass=RTPerson;
filter=(&(objectClass=RTPerson));
SLEEP 180000
Modify DN=c=US,o=Microsoft,cn= randnumber(1,250)@Microsoft.com,
objectclass=RTPerson; givenname=RANDALPHA(6):R;
SLEEP 180000
SEARCH BASE RETURN SUBSET DN=objectClass=RTPerson;
filter=(&(objectClass=RTPerson));
SLEEP 180000
Modify DN=c=US,o=Microsoft,cn= randnumber(1,250)@Microsoft.com,
objectclass=RTPerson; givenname=RANDALPHA(6):R;
SLEEP 180000
SEARCH BASE RETURN SUBSET DN=objectClass=RTPerson;
filter=(&(objectClass=RTPerson));
SLEEP 180000
Modify DN=c=US,o=Microsoft,cn= randnumber(1,250)@Microsoft.com,
objectclass=RTPerson; givenname=RANDALPHA(6):R;
SLEEP 180000
SEARCH BASE RETURN SUBSET DN=objectClass=RTPerson;
filter=(&(objectClass=RTPerson));
SLEEP 180000
Delete cn=sequnumber(1,10000,3)@Microsoft.com,ou=dynamic,o=Microsoft;
SLEEP 90000
QUIT
Information in this document, including URL and other Internet web site references, is subject to change without notice. The entire risk of the use or the results of the use of this resource kit remains with the user. This resource kit is not supported and is provided as is without warranty of any kind, either express or implied. The example companies, organizations, products, people and events depicted herein are fictitious. No association with any real company, organization, product, person or event is intended or should be inferred. Complying with all applicable copyright laws is the responsibility of the user. Without limiting the rights under copyright, no part of this document may be reproduced, stored in or introduced into a retrieval system, or transmitted in any form or by any means (electronic, mechanical, photocopying, recording, or otherwise), or for any purpose, without the express written permission of Microsoft Corporation.
Microsoft may have patents, patent applications, trademarks, copyrights, or other intellectual property rights covering subject matter in this document. Except as expressly provided in any written license agreement from Microsoft, the furnishing of this document does not give you any license to these patents, trademarks, copyrights, or other intellectual property.
© 1999-2000 Microsoft Corporation. All rights reserved.
Microsoft, NetMeeting, Windows and Windows NT are either registered trademarks or trademarks of Microsoft Corporation in the U.S.A. and/or other countries/regions.
The names of actual companies and products mentioned herein may be the trademarks of their respective owners.