

| Personalization & Membership -
Specific Terms |
Meaning |
| User | An individual user connected to a service. |
| Concurrent User | User active on the system; a subset of total users calculated based on user profile. |
| Member | A person who has information in the Membership Directory. |
| Attributes | Specific information associated with a file or an object. |
| Site Server Search | A search method that is included in Site Server. |
| ODBC | Open Database Connectivity, a database connectivity protocol. |
| Least Squares | Method of approximating a polynomial equation onto a non-linear data set. |
| General Terms | Meaning |
| Pentium Pro equivalent MHz (PPEM) | A unit of measure for processor work.
200 Pentium Pro equivalent MHz is delivered by a 200 MHz Pentium Pro processor. A computer with two 200 MHz Pentium Pro processors, will deliver 400 Pentium Pro equivalent MHz. |
Personalization features allow content providers to offer different content automatically to different users, matching stored information about available content to user needs and preferences.
For sites that require personalized Web pages, Personalization & Membership (P&M) provides Rule Builder and a set of Design-time controls (DTCs) for rapid content development with the Microsoft® FrontPage® 98 Web site creation and management tool or the Microsoft® Visual InterDev™ Web development system. For sites requiring heavy customization, the Active Data Object (ADO) and the Active User Object (AUO) are available, along with other system objects for use by software developers.
A model is designed in which total resource cost is calculated for a variable number of concurrent users. Essentially:
C = n × K
When C is resource cost, n = number of concurrent users, and K is the sum of the costs of each user operation.
Separate equations are created for each type of resource (CPU, memory, disk, and network). Thus, it is possible to intelligently predict the maximum number of users a particular hardware configuration can support, or conversely, the hardware resources required for a given number of users.
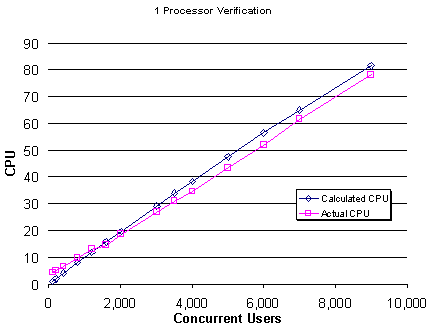
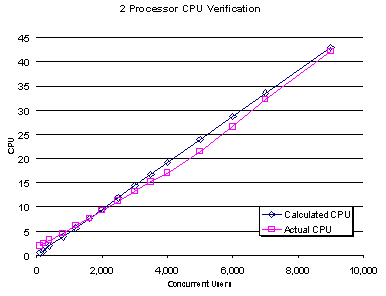
For credibility, the accuracy of these calculations was confirmed by comparing the results of the calculations using a series of verification tests. A test script is created that simulates a typical user behavior defined in the User Profile. The predicted resource costs calculated from the model are charted against actual resource costs generated by running the verification script.
The following configurations were used in testing.
| Web Server1: | CPU: | 4,2,1 x 200 MHz Pentium Pro |
| Memory: | 512 MB of RAM | |
| Network: | 100 BaseT switched | |
| Software: | Microsoft® Windows NT® 4.0 Option Pack, Microsoft® Internet Information Server | |
| LDAP Server: | CPU: | 2 x 200 MHz Pentium Pro |
| Memory: | 256 MB of RAM | |
| Network: | 100 BaseT switched | |
| Software: | Windows NT 4.0 Option Pack, Internet Information Server | |
| SQL Server: | CPU: | 4 x 200 MHz Pentium Pro |
| Memory: | 512 MB of RAM | |
| Disk: | 6 x 9.1-GB disks in a Hardware Raid 5 implementation, 100% write cache enabled | |
| Network: | 100 BaseT switched | |
| Software: | Microsoft® SQL Server™ 6.5 Service Pack 3 |
1. One Web server was used with different processor settings for processor scaling tests.
Rules define a relationship between member attributes and content attributes. For example, a rule that specifies that all users with, for example, level 4 in their clearance attribute, should receive news articles from the content database (DB) that have the value high in the privacy attribute. Rules thus allow a site builder to deliver personalized content to each site visitor.
Administrators build rules with an application called the Rule Builder. The Rule Builder retrieves both the content source schema (the fields in the content source that could be used in a rule) and the member schema from the Personalization &Membership directory service. Rules contain condition, exception, and action clauses that map on to the expression If X AND NOT Y then DO Z. The administrator creates such an expression by adding and modifying expression fragments which encapsulate the behavior of the condition, exception, and action clauses in quasi-English language clauses. Multiple rules are organized into rule sets; rules are then evaluated based on their priority in the rule set. The Rule Builder ultimately emits a rule set in the form of a Microsoft® Visual Basic® development system (VBScript) that can be inserted into an Active Server Page (ASP).
For the purposes of testing, the default member schema will be augmented with three attributes with the respective types of string, integer, and date. The content source schema will similarly include attributes of type string, integer, and date. All rules will operate on these attributes. Each record in the content source will also include a content field, which contains the string to be output to the HTML stream that the client sees when triggered by a rule.
The directory service will be a Microsoft® SQL Server™ database containing 200,000 users. The SQL content source database will contain 5,000 records. The content field in each database will contain strings between 1 and 500 characters in length. The Microsoft® Site Server Search content source will be an index of approximately 200 MB worth of .html files.
Tested Personalization Transactions
| Transactions | Description |
| AUO Membership | Simple AUO script displaying member's given name with Membership basic security enabled. |
| Site Server Search1 | Site Server Search type search made with the Rule Builder; the query returns 1 value. |
| Site Server Search 10 | Similar search; the query returns 10 values. |
| Site Server Search100 | Same as the previous search; the query returns 100 values. |
| Odbc 1 | ODBC search generated using the Rule Builder; the query returns 1 value. |
| Odbc 10 | Similar ODBC search; the query returns 10 values. |
| Odbc 100 | Same as the previous search; the query returns 100 values. |
The following user profile was created to simulate a user visiting a personalized Web site. Eighty percent of the pages are lightly personalized, in this case only using their whole name in appropriate description fields. The other 20 percent of the time the user goes to a page where the linked content is displayed in some way, based on the known user information. In this scenario, it is randomly selected between the six different classifications. The user is active on the site for 10 minutes on average, and retrieves five pages. There are no additional objects on the pages.
| Elements | Value | Description |
| Personalized light pages | 80% | Simple AUO script with Membership basic security enabled. |
| Personalized heavy pages | 20% | One of the six search pages described in the transaction table. |
| Requests per visit | 5 | Number of HTTP GET requests per visit. |
| User life cycle | 10 Min. | Active interval. |
This user profile generates this transaction frequency table.
| Transactions | Operations per session | Frequency |
| Simple AUO | 4 | 0.006667 per sec. |
| Site Server Search 1 Element | 1/6 | 0.000333 per sec. |
| Site Server Search 10 Element | 1/6 | 0.000333 per sec. |
| Site Server Search 100 Element | 1/6 | 0.000333 per sec. |
| ODBC 1 Elmt | 1/6 | 0.000333 per sec. |
| ODBC 10 Elmt | 1/6 | 0.000333 per sec. |
| ODBC 100 Elmt | 1/6 | 0.000333 per sec. |
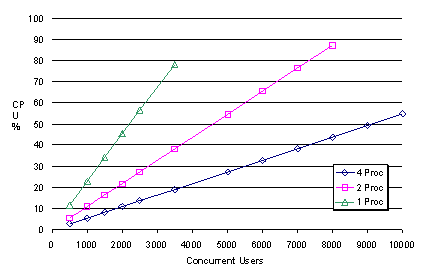
Based on the data collected in this document, the following assertions can be made about scaling and performance:
Every user who accesses the Web server increases the hardware utilization on that Web server. This chart shows the expected number of concurrent users based on the processor utilization calculations derived from the previous table. This graph stops at the practical maximum limit (10,000) of Microsoft® Windows NT® Server’s built-in Web server, Internet Information Server (IIS) connections.
The PPEM costs of the transactions for the personalization service are not all constants. They vary with the rate of the transaction. When the transaction rate is low, the costs tend to be higher, and likewise when the transaction rate is higher, the costs of some of the transactions rise. This table represents the least squares approximation of the PPEM versus Transaction Rate that were measured in our test environment. The relative accuracy of these measurements is confirmed in the following verification section.
The PPEM at a given rate on a given processor: PPEM = r x (C1 + C2r + C3r2)
An example of PPEM calculation is given in Appendix B.
| Transaction | Procs | Valid Range for r | PPEM C1 | PPEM C2 | PPEM C3 |
| AUO Membership | 4 | 1 - 127 | 2.71 | ||
| Site Server Search 1 | 4 | 1 - 31 | 3.75 | ||
| Site Server Search 10 | 4 | 1 - 31 | 4.6 | ||
| Site Server Search 100 | 4 | 1 - 17 | 21 | ||
| ODBC 1 | 4 | 1 - 38 | 8.4362 | -0.2865 | 0.0088 |
| ODBC 10 | 4 | 1 - 30 | 7.7212 | 0.1341 | |
| ODBC 100 | 4 | 1 - 7.5 | 31.0121 | 0.234 | |
| AUO Membership | 2 | 1 - 87.3 | 2 | ||
| Site Server Search 1 | 2 | 1 - 31 | 5.27 | ||
| Site Server Search 10 | 2 | 1 - 31 | 7.5 | ||
| Site Server Search 100 | 2 | 1 - 12.43 | 27 | ||
| ODBC 1 | 2 | 1 - 38.3 | 7.0293 | ||
| ODBC 10 | 2 | 1 - 29.4 | 9.7827 | ||
| ODBC 100 | 2 | 1 - 7.5 | 34.3475 | ||
| AUO Membership | 1 | 1 - 34 | 1.5612 | -0.0102 | |
| Site Server Search 1 | 1 | 1 - 32 | 10.3081 | -0.3054 | |
| Site Server Search 10 | 1 | 1 - 32 | 12.0785 | -0.367 | |
| Site Server Search 100 | 1 | 1 - 19 | 32.1771 | -4.1438 | 0.31 |
| ODBC 1 | 1 | 1 - 39 | 7.7407 | -0.0843 | |
| ODBC 10 | 1 | 1 - 27 | 10.0283 | -0.01049 | |
| ODBC 100 | 1 | 1 - 6 | 36.5831 | -1.0156 |
Note Simple AUO scales to multiple processors. The underlying search mechanisms do not scale as well. Also note that the ODBC scaling will improve with the Microsoft Data Access Components (MDAC) version 2.0 update.
Each concurrent connection uses approximately 24 KB on the Web server. Thus, 500 users x 24 KB is 11.7 MB. There is an additional overhead associated with running the AUO code, the Site Server Search code, and the ODBC code. However, this is a static cost of less than 3 MB for each of these services. Hence, it should not radically affect the memory cost of configuring a server.
| Users | Megabyte Overhead |
| 500 | 11.72 |
| 1000 | 23.44 |
| 1500 | 35.16 |
| 2000 | 46.88 |
| 2500 | 58.59 |
| 3500 | 82.03 |
| 5000 | 117.19 |
| 6000 | 140.63 |
| 7000 | 164.06 |
| 8000 | 187.50 |
| 9000 | 210.94 |
| 10000 | 234.38 |
The AUO PM transaction does a simple base lookup for the user information when it authenticates. The information is then stored in the Authentication Service cache and when AUO requests the user name; it does not have to go back to SQL Server.
The Site Server Search tests actually use the Search service for its queries. The search catalog is on the Web server, so there is no Microsoft SQL Server query.
The ODBC request is resolved by an SQL query. These costs are measured and represent some level of caching. The results vary with the complexity of the query and the arrangement of the SQL tables of the content data. The matching user property for determining content personalization does not need to be read from the database because it was in the Authentication Service cache. The broker cache contains the entire user object.
SQL Server Resource Utilization per Transaction Type
| Transaction | PPEM | SQL I/O |
| Auo_pm | 0.3 | 2 |
| Site Server Search12 | 0 | 0 |
| Site Server Search10 | 0 | 0 |
| Site Server Search100 | 0 | 0 |
| ODBC 1 | 3 | 8 |
| ODBC 10 | 11 | 43 |
| ODBC 100 | 60 | 250 |
2. Site Server Search is a separate search engine.
Resource usage calculations are created to answer the question, “What is the cost to support a given number of users?” And given this information, the next question is, “What is the maximum number of users this configuration of resources can support?”
In order to determine capacity for each resource, equations can be designed that measure resource cost against number of users.
Before we look at specific components of the CPU, disk, and network calculations, we will examine the user profile. Using the number of concurrent users to determine maximum capacity is difficult if we do not take into consideration user behavior.
T= n x f
Using the Site Server Search 1 example, the equation becomes:
T = n x .000333
If we wanted to find out how many Site Server Search 1 transactions are generated per second for 5,000 concurrent users per connection, the equation becomes:
T = 5,000 x .000333 = 1.6667
The following is an expansion of the entire table.
| Concurrent Users | Simple AUO | Site Server Search 1 Elmt | Site Server Search 10 Elmt | Site Server Search 100 Elmt | ODBC 1 Elmt | ODBC 10 Elmt | ODBC 100 Elmt |
| 500 | 3.333 | 0.167 | 0.167 | 0.167 | 0.167 | 0.167 | 0.167 |
| 1000 | 6.667 | 0.333 | 0.333 | 0.333 | 0.333 | 0.333 | 0.333 |
| 1500 | 10.000 | 0.500 | 0.500 | 0.500 | 0.500 | 0.500 | 0.500 |
| 2000 | 13.333 | 0.667 | 0.667 | 0.667 | 0.667 | 0.667 | 0.667 |
| 2500 | 16.667 | 0.833 | 0.833 | 0.833 | 0.833 | 0.833 | 0.833 |
| 3500 | 23.333 | 1.167 | 1.167 | 1.167 | 1.167 | 1.167 | 1.167 |
| 5000 | 33.333 | 1.667 | 1.667 | 1.667 | 1.667 | 1.667 | 1.667 |
| 6000 | 40.000 | 2.000 | 2.000 | 2.000 | 2.000 | 2.000 | 2.000 |
| 7000 | 46.667 | 2.333 | 2.333 | 2.333 | 2.333 | 2.333 | 2.333 |
| 8000 | 53.333 | 2.667 | 2.667 | 2.667 | 2.667 | 2.667 | 2.667 |
| 9000 | 60.000 | 3.000 | 3.000 | 3.000 | 3.000 | 3.000 | 3.000 |
| 10000 | 66.667 | 3.333 | 3.333 | 3.333 | 3.333 | 3.333 | 3.333 |
Calculate the total CPU cost at 5,000 users for all seven transactions in the user profile. Suppose we use the Site Server Search 1 transaction again and arbitrarily choose the 4-processor numbers.
PPEMNL1 = Rate (PPEM C1 + Rate x PPEM C2)
PPEMNL1 = 1.67 (5.27 + 1.67 x 0) = 6.25 PPEM
The following is an expansion of the entire table for a 4-processor.
| Conc. Users | Simple AUO PPEM | Site Server Search 1 PPEM | Site Server Search 10 PPEM | Site Server Search 100 PPEM | ODBC 1 PPEM | ODBC 10 PPEM | ODBC 100 PPEM | Total PPEM | % CPU |
| 500 | 9.03 | 0.63 | 0.77 | 3.50 | 1.40 | 1.29 | 5.18 | 21.79 | 2.72 |
| 1000 | 18.07 | 1.25 | 1.53 | 7.00 | 2.78 | 2.59 | 10.36 | 43.58 | 5.45 |
| 1500 | 27.10 | 1.88 | 2.30 | 10.50 | 4.15 | 3.89 | 15.56 | 65.38 | 8.17 |
| 2000 | 36.13 | 2.50 | 3.07 | 14.00 | 5.50 | 5.21 | 20.78 | 87.19 | 10.90 |
| 2500 | 45.17 | 3.13 | 3.83 | 17.50 | 6.84 | 6.53 | 26.01 | 108.99 | 13.62 |
| 3500 | 63.23 | 4.38 | 5.37 | 24.50 | 9.47 | 9.19 | 36.50 | 152.63 | 19.08 |
| 5000 | 90.33 | 6.25 | 7.67 | 35.00 | 13.31 | 13.24 | 52.34 | 218.13 | 27.27 |
| 6000 | 108.40 | 7.50 | 9.20 | 42.00 | 15.80 | 15.98 | 62.96 | 261.84 | 32.73 |
| 7000 | 126.47 | 8.75 | 10.73 | 49.00 | 18.24 | 18.75 | 73.64 | 305.57 | 38.20 |
| 8000 | 144.53 | 10.00 | 12.27 | 56.00 | 20.63 | 21.54 | 84.36 | 349.33 | 43.67 |
| 9000 | 162.60 | 11.25 | 13.80 | 63.00 | 22.97 | 24.37 | 95.14 | 393.13 | 49.14 |
| 10000 | 180.67 | 12.50 | 15.33 | 70.00 | 25.26 | 27.23 | 105.97 | 436.96 | 54.62 |
The following is an expansion of the entire table for a 2-processor.
| Conc. Users | Simple AUO PPEM | Site Server Search 1 PPEM | Site Server Search 10 PPEM | Site Server Search 100 PPEM | ODBC 1 PPEM | ODBC 10 PPEM | ODBC 100 PPEM | Total PPEM | % CPU |
| 500 | 6.67 | 0.88 | 1.25 | 4.50 | 1.17 | 1.63 | 5.72 | 21.82 | 5.46 |
| 1000 | 13.33 | 1.76 | 2.50 | 9.00 | 2.34 | 3.26 | 11.45 | 43.64 | 10.91 |
| 1500 | 20.00 | 2.64 | 3.75 | 13.50 | 3.51 | 4.89 | 17.17 | 65.46 | 16.37 |
| 2000 | 26.67 | 3.51 | 5.00 | 18.00 | 4.69 | 6.52 | 22.90 | 87.29 | 21.82 |
| 2500 | 33.33 | 4.39 | 6.25 | 22.50 | 5.86 | 8.15 | 28.62 | 109.11 | 27.28 |
| 3500 | 46.67 | 6.15 | 8.75 | 31.50 | 8.20 | 11.41 | 40.07 | 152.75 | 38.19 |
| 5000 | 66.67 | 8.78 | 12.50 | 45.00 | 11.72 | 16.30 | 57.25 | 218.22 | 54.55 |
| 6000 | 80.00 | 10.54 | 15.00 | 54.00 | 14.06 | 19.57 | 68.70 | 261.86 | 65.46 |
| 7000 | 93.33 | 12.30 | 17.50 | 63.00 | 16.40 | 22.83 | 80.14 | 305.50 | 76.38 |
| 8000 | 106.67 | 14.05 | 20.00 | 72.00 | 18.74 | 26.09 | 91.59 | 349.15 | 87.29 |
| 9000 | 120.00 | 15.81 | 22.50 | 81.00 | 21.09 | 29.35 | 103.04 | 392.79 | 98.20 |
The following is an expansion of the entire table for a 1-processor.
| Conc. Users | Simple AUO PPEM | Site Server Search 1 PPEM | Site Server Search 10 PPEM | Site Server Search 100 PPEM | ODBC 1 PPEM | ODBC 10 PPEM | ODBC 100 PPEM | Total PPEM | % CPU |
| 500 | 5.20 | 1.71 | 2.00 | 5.25 | 1.29 | 1.67 | 6.07 | 23.19 | 11.60 |
| 1000 | 10.41 | 3.40 | 3.99 | 10.28 | 2.57 | 3.34 | 12.08 | 46.07 | 23.03 |
| 1500 | 15.61 | 5.08 | 5.95 | 15.09 | 3.85 | 5.01 | 18.04 | 68.63 | 34.31 |
| 2000 | 20.82 | 6.74 | 7.89 | 19.70 | 5.12 | 6.68 | 23.94 | 90.88 | 45.44 |
| 2500 | 26.02 | 8.38 | 9.81 | 24.12 | 6.39 | 8.35 | 29.78 | 112.85 | 56.42 |
| 3500 | 36.43 | 11.61 | 13.59 | 32.39 | 8.92 | 11.69 | 41.30 | 155.92 | 77.96 |
Note The projected CPU load bounds the single processor system at 3500 maximum concurrent users.
The SQL Server input/output (I/O) for AUO membership transactions assumes no caching. The SQL Server I/Os for the ODBC calls are measured using the generated database. Actual results may vary.
In order to calculate the rate for any number of users, multiply the frequency of each transaction by the number of I/Os for each call.
At 500 users:
Extract the frequency from the table. AUO Membership is 3.33 per second. Each AUO generates 2 I/Os per second from the previous table for 6.66 I/Os.
The frequency of the Site Server Search pages are all zero because the requests do not use SQL Server.
FrequencyODBC 1 0.1667 x SQL I/O ODBC 1 8 = 1.33 I/O/s
FrequencyODBC 10 0.1667 x SQL I/O ODBC 1 43 = 7.17 I/O/s
FrequencyODBC 100 0.1667 x SQL I/O ODBC 1 250 = 41.67 I/O/s
Add all the elements together for a total of 56.83 I/O per second.
This table is the expansion of this equation for all users.
| Users | SQL I/O transactions/sec |
| 500 | 56.83 |
| 1000 | 113.67 |
| 1500 | 170.50 |
| 2000 | 227.33 |
| 2500 | 284.17 |
| 3500 | 397.83 |
| 5000 | 568.33 |
| 6000 | 682.00 |
| 7000 | 795.67 |
| 8000 | 909.33 |
| 9000 | 1023.00 |
| 10000 | 1136.67 |
To support 10,000 concurrent users, the SQL Server system must support 1136.67 SQL Server I/O transactions per second on the primary data device. In this scenario it is all read traffic. This is a worst-case scenario where there is no data overlap. Furthermore, it is assuming 0 percent SQL Server caching, which is highly unlikely. The steps to calculate the RAID array to support this are as follows.
Disks for:
RAID Level 0 =ceiling ((ReadMax/sec + WriteMax /sec)/60average maximum disk I/O speed)
RAID Level 1 = ceiling (ReadMax/sec + (2 x WriteMax /sec))/60average maximum disk I/O speed)
RAID Level 5 = ceiling ((ReadMax+ (4*WriteMax /sec))/60average maximum disk I/O speed)
The denominator of 60 assumes a 4.3-GB disk drive in accordance with the Compaq performance documentation. Faster disk drivers and a newer controller yield different performance.
RAID Level 0 = ceiling (1137 + 0) / 60 = ceiling(18.95) = 19
RAID Level 1 = ceiling (1137 + 2 x 0) / 60 = ceiling(18.95) = 19
RAID Level 5 = ceiling (1137 + 4 x 0) / 60 = ceiling(18.95) = 19
This example, based on the same user profile used throughout this document, illustrates how to determine an optimal configuration for a given number of users.
Profile Description
The Web site has 200,000 total users. On average, each user connects for 10 minutes and visits five Web pages. There are four light personalized pages. One page has content associated with it. All pages are authenticated with Membership Directory Basic Authentication.
Two-percent of total users are online simultaneously at peak time, with 4,000 concurrent users.
Total light personalized pages per second during peak time is 4000Users x .006667rate = 26.67 per sec.
The last page is randomly chosen in an equal distribution between the remaining six content generation Web pages (for example, the ODBC 10 element page is hit 4000users x .000333rate = 1.33 per sec).
Profile Calculations
The number of requests per second is given by
N x F
The number of concurrent users N is computed as above and the frequency F is the number of queries per user per second.
This table of rates is generated for all transactions.
| Transaction | Queries |
| Simple AUO | 26.67 per sec |
| Site Server Search 1 Elmt | 1.33 per sec |
| Site Server Search 10 Elmt | 1.33 per sec |
| Site Server Search 100 Elmt | 1.33 per sec |
| ODBC 1 Elmt | 1.33 per sec |
| ODBC 10 Elmt | 1.33 per sec |
| ODBC 100 Elmt | 1.33 per sec |
Sample Processor Calculations
For each of the transactions, compute the expected CPU cost. The PPEM model was developed by assuming the cost of running the individual .asp. The model assumes that the total cost of running all the ASPs together will not bring the system into the area of context switching. Context switching on multi-processor systems running .asp files is expensive at higher transaction rates.
It is important to note that the PPEM costs are only accurate to predict approximately 80 percent utilization on a processor. Above these levels, running a computer with greater CPU capacity is recommended. (The best choice is to increase the clock speed.) The other solution is to add another server to distribute the load.
Furthermore each of the PPEM equations is only valid up to the maximum range measured.
In order to calculate the cost for the simple AUO measurement for a 4-processor:
PPEMAUO simple = Rate (PPEM C1 + Rate x PPEM C2)
26.67 x (2.71PPEM + 26.67*0) = 72.27 PPEM
for the remaining 6
1.33 x (3.75PPEM + 1.33*0) = 5.00 PPEM
1.33 x (4.6PPEM + 1.33*0) = 6.13 PPEM
1.33 x (21PPEM + 1.33*0) = 28.00 PPEM
1.33 x (8.4362 - 0.2865 x 1.33 + 0.0088*1.332 ) = 10.76 PPEM
1.33 x (7.7212 + 0.1341 x 1.33) = 10.53 PPEM
1.33 x (31.0121 + 0.234 x 1.33) = 41.77 PPEM
For a total of 174.46 PPEM or 21.81 percent CPU utilization on a 4-processor.
To calculate the PPEM from observed data, the load was simulated on a per transaction basis. This was performed using Site Server Search single-return-valued scripts. An automated script was run that cycles through a changing user load. The values were captured in a perfmon.exe log file. This log file was then exported to a tab-delimited text file and imported into Microsoft® Excel. Then the log was distributed through an Excel macro, and averaged. Each row represents several minutes of the transaction load. The authentication counter is observed in order to confirm that the entire process is working.
To establish a valid range of samples, we observe context switches. The context switch rate must be below a certain threshold to be considered running optimally. However, the processor should be exercised across a full range.
The total processor time must be multiplied by the clock capacity of the system, which in this case is 4 x 200, and then divided through by the number of requests/sec. This generates the PPEM values at different transaction rates.
| Requests Executing | Requests/Sec | % Total Processor Time | Context Switches/sec | ClearText Auth successes per second | PPEM |
| Active Server Pages | Active Server Pages | System | System | Site Server Authentication Service | |
| 0.00 | 1.30 | 1.62 | 678.65 | 1.30 | 9.94 |
| 0.07 | 2.57 | 2.43 | 719.13 | 2.57 | 7.55 |
| 0.15 | 5.15 | 3.90 | 808.77 | 5.15 | 6.07 |
| 0.17 | 7.70 | 4.53 | 938.27 | 7.70 | 4.70 |
| 0.15 | 10.48 | 7.74 | 1,044.19 | 10.48 | 5.91 |
| 0.40 | 12.93 | 12.49 | 1,233.41 | 12.93 | 7.73 |
| 0.23 | 15.69 | 13.03 | 1,452.47 | 15.69 | 6.64 |
| 0.65 | 20.81 | 16.03 | 1,885.67 | 20.81 | 6.16 |
| 0.83 | 27.60 | 23.43 | 3,740.51 | 27.60 | 6.79 |
| 0.95 | 29.82 | 30.53 | 4,644.51 | 29.82 | 8.19 |
| 1.44 | 32.11 | 36.17 | 6,511.10 | 32.11 | 9.01 |
| 1.78 | 34.26 | 36.97 | 7,757.42 | 34.26 | 8.63 |
| 3.34 | 36.02 | 41.04 | 9,502.15 | 36.02 | 9.12 |
| 2.98 | 38.02 | 47.62 | 12,137.10 | 38.02 | 10.02 |
The overall PPEM is then calculated by taking a polynomial fitting using a least squares approximation of the PPEM value at the transaction rate. This generates the formulas presented in Chapter 1 for each transaction.
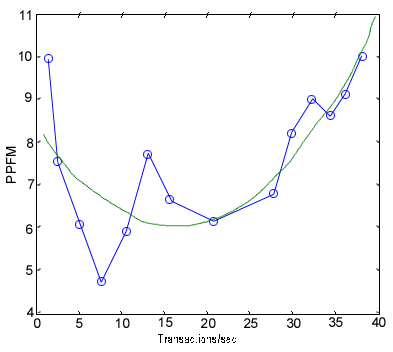
In this case, the polynomial equation is PPEM over rate = 8.4362 - 0.2865 x T + 0.0088 x T2.
| Users | Requests/Sec | Computed CPU | Actual CPU |
| 99.87 | 0.42 | 1.02 | 4.46 |
| 200.00 | 0.82 | 2.01 | 5.21 |
| 399.87 | 1.66 | 4.03 | 6.66 |
| 799.74 | 3.30 | 7.97 | 9.66 |
| 1,199.62 | 4.96 | 11.93 | 13.22 |
| 1,599.21 | 6.58 | 15.78 | 14.65 |
| 2,004.49 | 8.25 | 19.68 | 18.58 |
| 3,000.38 | 12.36 | 29.16 | 26.93 |
| 3,498.21 | 14.43 | 33.86 | 30.96 |
| 3,998.33 | 16.47 | 38.43 | 34.79 |
| 4,998.33 | 20.61 | 47.55 | 43.41 |
| 5,998.21 | 24.73 | 56.42 | 51.81 |
| 6,996.15 | 28.79 | 64.93 | 61.57 |
| 8,992.44 | 37.01 | 81.61 | 78.05 |
| Users | Requests/Sec | Computed CPU | Actual CPU |
| 100.00 | 0.42 | 0.49 | 1.98 |
| 199.94 | 0.83 | 0.96 | 2.45 |
| 399.87 | 1.66 | 1.92 | 3.12 |
| 799.94 | 3.30 | 3.82 | 4.45 |
| 1,199.74 | 4.94 | 5.72 | 6.20 |
| 1,599.68 | 6.60 | 7.64 | 7.63 |
| 1,999.42 | 8.26 | 9.56 | 9.25 |
| 2,499.55 | 10.31 | 11.94 | 11.23 |
| 2,998.73 | 12.38 | 14.33 | 13.14 |
| 3,499.04 | 14.43 | 16.71 | 15.20 |
| 3,998.40 | 16.48 | 19.08 | 17.05 |
| 4,998.59 | 20.59 | 23.84 | 21.45 |
| 5,998.91 | 24.73 | 28.64 | 26.54 |
| 6,997.37 | 28.90 | 33.46 | 32.24 |
| 8,995.19 | 37.04 | 42.89 | 42.08 |
| Users | Requests/Sec | Computed CPU | Actual CPU |
| 100.00 | 0.42 | 0.25 | 1.29 |
| 199.94 | 0.82 | 0.48 | 1.49 |
| 400.00 | 1.65 | 0.97 | 1.89 |
| 800.00 | 3.31 | 1.95 | 2.67 |
| 1199.68 | 4.95 | 2.92 | 3.72 |
| 1599.42 | 6.60 | 3.89 | 4.51 |
| 1999.62 | 8.25 | 4.87 | 5.29 |
| 2499.36 | 10.31 | 6.08 | 6.43 |
| 2999.10 | 12.36 | 7.29 | 7.52 |
| 3498.14 | 14.45 | 8.53 | 8.61 |
| 3998.97 | 16.53 | 9.75 | 9.80 |
| 4998.59 | 20.60 | 12.16 | 12.09 |
| 5997.76 | 24.75 | 14.61 | 14.97 |
| 6997.88 | 28.83 | 17.01 | 17.31 |
| 8995.19 | 37.09 | 21.90 | 22.99 |
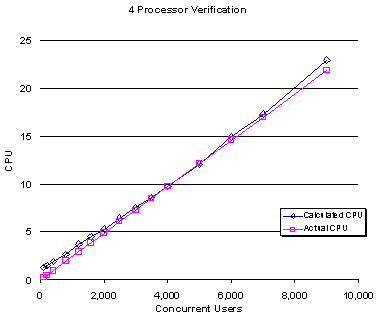
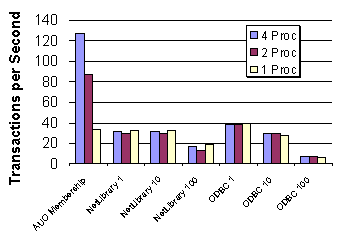
Table of Maximum Rates
| Transaction | 4 Proc | 2 Proc | 1 Proc |
| AUO Membership | 127 | 87.3 | 34 |
| Site Server Search 13 | 31 | 29.77 | 32 |
| Site Server Search 10 | 31 | 29.9 | 32 |
| Site Server Search 100 | 17 | 12.43 | 19 |
| ODBC 14 | 38 | 38.3 | 39 |
| ODBC 10 | 30 | 29.4 | 27 |
| ODBC 1005 | 7.5 | 7.5 | 6 |
3.The Site Server Search subsystem was assigned 32 threads. This number of running threads was the bottleneck for throughput.
4.The SQL Server computer that supported the ODBC queries was configured to have additional open connections to support the queries.
5.The disk subsystem that supported the content database was the bottleneck. The maximum throughput for the system will vary greatly based on the content database used.
All counters noted can be found in the Microsoft® Windows NT® Performance Monitor. These counters will be distributed among the computers in the Personalization & Membership service group. The counters in the system and memory objects can be used to monitor capacity.
Connection Current
Static Search per sec
Automatic Cookie Auth Successes per sec
ClearText Auth successes per sec
DPA Auth successes per sec
HTML Forms Auth successes per sec
Results rate
SQL I/O transactions per sec
System/% Total Processor Time
Disk Writes/secDisk activity should not sustain maximum transaction rate
Disk Reads/sec
Requests/sec
Current requests
Request Execution Time
NonAnonymous Users/sec
Get requests/sec
Context switches/secshould be less than 15,000 on a 4-processor system
%Total Processor should be less than 80%
%Processor Utilization (average)should be less than 80% (for each processor)
Available Bytesshould be greater than 4 MB
This is called by the InetMon script
AuoPure.asp
<%
set user = server.createobject("membership.userobjects")
response.write("the full name is " & user.get("cn") & "<br>")
%>
Get_auo.txt
USER tstRANDNUMBER(1,10000) password
GET url:/auo_pure.asp
SLEEP RANDNUMBER(300,800)
LOOP 9
GET url:/auo_pure.asp
SLEEP RANDNUMBER(300,800)
ENDLOOP
DISCONNECT
The .asp files and the .prf files do most of the work, but they were all generated using the Rule Builder.
Verification script
USER tstRANDNUMBER(1,10000) password
LOOP 4
GET url:/auo_pure2.asp
SLEEP 24000
ENDLOOP
%84 SKIP 2
GET url:/u2perfproj/rp1odbc.asp
SKIP 13
%80 SKIP 2
GET url:/u2perfproj/rp2odbc.asp
SKIP 10
%75 SKIP 2
GET url:/u2perfproj/rp3odbc.asp
SKIP 7
%67 SKIP 2
GET url:/u2perfproj/rp1nl.asp
SKIP 4
%50 SKIP 2
GET url:/u2perfproj/rp2nl.asp
SKIP 1
GET url:/u2perfproj/rp3nl.asp
SLEEP 24000
DISCONNECT
Information in this document, including URL and other Internet web site references, is subject to change without notice. The entire risk of the use or the results of the use of this resource kit remains with the user. This resource kit is not supported and is provided as is without warranty of any kind, either express or implied. The example companies, organizations, products, people and events depicted herein are fictitious. No association with any real company, organization, product, person or event is intended or should be inferred. Complying with all applicable copyright laws is the responsibility of the user. Without limiting the rights under copyright, no part of this document may be reproduced, stored in or introduced into a retrieval system, or transmitted in any form or by any means (electronic, mechanical, photocopying, recording, or otherwise), or for any purpose, without the express written permission of Microsoft Corporation.
Microsoft may have patents, patent applications, trademarks, copyrights, or other intellectual property rights covering subject matter in this document. Except as expressly provided in any written license agreement from Microsoft, the furnishing of this document does not give you any license to these patents, trademarks, copyrights, or other intellectual property.
© 1999-2000 Microsoft Corporation. All rights reserved.
Microsoft, FrontPage, Visual Basic, Visual InterDev, and Windows NT are either registered trademarks or trademarks of Microsoft Corporation in the U.S.A. and/or other countries/regions.
The names of actual companies and products mentioned herein may be the trademarks of their respective owners.