

| Search-Specific Terms | Meaning |
| Crawl space | The collection of URLs, files, or Exchange databases crawled from which the catalog is built. |
| MaxRecords | ASP control variable limiting the number of records returned by each query. |
| OptimizeFor=“NoHitCount” | ASP logic instructing the query to forgo calculating the total number of query matches. |
| General Terms | Meaning |
| Pentium Pro equivalent MHz (PPEM) | A unit of measure for processor work.
A 200 Pentium Pro equivalent MHz is delivered by a 200 MHz Pentium Pro processor. A machine with two 200 MHz Pentium Pro processors will deliver 400 Pentium Pro equivalent MHz. |
This document evaluates the performance and scalability characteristics of Microsoft® Site Server version 3.0 Search. The document addresses two key Search functions: catalog builds and crawling and client querying. For each function, the document demonstrates procedures for identifying performance and scalability characteristics. Using these procedures, administrators can calculate the expected performance for a particular Catalog Build Server configuration. Administrators can also calculate the expected performance for particular Search Server configurations and can determine how query loads impact hardware resources. This information can be used to calculate maximum capacity for a particular hardware configuration and to identify which resources would satisfy greater capacity needs.
To accurately analyze Search performance, the crawling (Catalog Build Server) and querying (Search Server) functions must be analyzed separately. Once individual performance characteristics are identified, resources can be separately assigned to each function as needed. Crawl performance can be quantified by measuring the kB/second or documents/second, which are filtered from the crawl space into the catalog. Thus the size of the crawl space and the number of documents within the crawl space become critical parameters in determining the time required for a given crawl and catalog build to complete. Query performance can be measured by simulating varying user load conditions. Each simulated user executes a search request embodying characteristics representative of the anticipated demands of the Web server under consideration. The user loading and search request characteristics are controlled by InetMonitor.
In analyzing query performance, a user profile is created. This profile should capture those querying characteristics representative of a typical user. It should also specify those quantities, which most substantially affect the query rate, such as the desired number of records returned, and whether a hit count is desired. The user profile is used to compute the particular resource costs associated with each query. It is then possible to predict how user load will impact computer resources.
Processor resource cost is calculated by computing the fraction of maximum clock cycles utilized per transaction per second. Multiprocessor Pentium Pro architectures were used in the preparation of this document, so this quantity is called Pentium Pro Equivalent Megahertz (PPEM). It is defined by [(number processors) x (MHz per processor) x (%CPU time utilized)/(transaction rate per second)]. For example, if a given transaction has a throughput of 10 transactions per second, and this generates sixty percent CPU utilization on a 2-processor 200MHz Pentium Pro server, then this resource cost comes to (2-processors) x (200 MHz/processor) x (.6 CPU utilization)/(10 queries/sec)=24 PPEM.
The relationship between processor consumption and transaction rate is approximated by equations which can be used to intelligently predict the resources required to support a given number of users and desired transaction rate. The relationship between memory consumption and user loading is quantified similarly.
For credibility, the accuracy of these calculations is confirmed by comparing the results of the calculations with a series of verification tests. A test script is created which simulates querying behavior defined by the user profile. Then predicted resource costs are calculated from the model and compared against actual resource costs generated by running the verification script.
Given a model for predicting resource requirements, it is important to test the scalability of these resources. Under many operating scenarios, Search has been shown to be processor-bound. Therefore, it is important for capacity planning purposes to know how transactional behavior changes with increasing numbers of processors. The analysis performed here quantifies these relationships for 1-, 2-, and 4-processor shared memory architectures. Since memory, disk, and network consumption is more limited than processor consumption, this document will focus primarily on how CPU utilization affects performance. Latency is also reported.
In the search test scenarios, one server was used in the following configuration:
| Web Server: | CPU: | 1, 2, and 4 x 200 MHz Pentium Pro |
| Memory: | 64, 128, 256 MB of RAM | |
| Disk: | 5 x 4.3 GB SCSI | |
| File System: | NTFS | |
| Network: | Intel EtherExpress Pro/100+ on 100 MB switched Ethernet | |
| Software: | Microsoft® Windows NT® 4.0, Service Pack 3, K2 version 622 (final), Microsoft ® Site Server 6.0.x |
In the crawl and catalog test scenarios, there is a catalog server which performs crawling and catalog building, and a document server which contains the file crawl space. These two servers were used in the following configuration:
| Catalog Server: | CPU: | 4 x 200 MHz Pentium Pro |
| Memory: | 256 MB of RAM | |
| Disk: | 12 x 4.3 GB SCSI | |
| File System: | NTFS | |
| Network: | Netelligent 10/100 TX PCI UTP Bus 2 on 100 MB switched Ethernet | |
| Software: | Windows NT 4.0, Service Pack 3, K2 version 622 (final) |
| Document Server: | CPU: | 1, 2, 4 x 200 MHz Pentium Pro |
| Memory: | 64, 128, 256 MB of RAM | |
| Disk: | 5 x 4.3 GB SCSI | |
| File System: | NTFS | |
| Network: | Intel EtherExpress Pro/100+ on 100 MB switched Ethernet | |
| Software: | Windows NT 4.0, Service Pack 3, K2 version 622 (final), Site Server 6.0.x |
Search enables businesses to gather documents located in various places, including Web servers and databases, and to build a catalog from these documents. It finds and gathers documents from the locations specified in a crawl, then indexes the documents in a catalog. Users can access the cataloged information on a Web site and easily search and find documents they need. Site visitors enter a query on a search page, and any documents in the catalog that match the search query are listed on a results page. The site visitor clicks a link, and the original document is displayed.
To analyze performance and scalability for crawl and catalog build functionality, the following crawl space was used:
| Crawl Space | Size |
| HTML files | 57,738 |
| Folders | 3,244 |
| Total documents | 55467 |
| Total file size | 169,094,571 bytes |
To analyze performance and scalability for query functionality, the following catalog profile was used, unless otherwise noted:
| Catalog Profile | Size |
| Indexed documents | 168,217 |
| Catalog size | 90 MB |
| Property store size | 145 MB |
| Unique keys | 1,457,006 |
It should be noted that most results presented in this document were obtained on systems with 256 MB of RAM, which exceeds the size of the property store here.
User profiles are created in Tables 1 and 2, which represent typical behavior of a single user.
The Search user profile is broken down into two types of profiles. One is used for interactive querying by online users, when users are actively performing searches while connected to the Search server. In this case it is important to return the hit count.
A batch mode profile is created when an application runs to search for briefs that a number of users have signed up for. In this case, it is not important to return the hit count. Hit count is turned off to improve performance.
Table 1: Online Search User Profile Used in This Report
| Query type | Queries/session | Frequency1 | Hit count |
| Search return 200 records | 1 | 0.000556 | On |
| Search return 40 records | 1 | 0.000556 | On |
| Search return 80 records | 1 | 0.000556 | On |
| Search return 20 records | 3 | 0.001667 | On |
| Total operations in session | 6 | ||
| Session duration | 30 Minutes |
1. Frequencies are listed in units of queries per user per session per second.
Table 2: Batch Mode Search User Profile Used in This Report
| Query type | Queries /session | Frequency1 | Hit count |
| Search return 20 records | 4 | .0006667 | Off |
| Session duration | 100 Minutes |
The crawl and catalog build functions approach optimal performance with a 2-processor, 128MB document (Web) server configuration. Adding additional processors does not significantly enhance performance. For the crawl space tested, the crawl space to catalog transfer rate was 30 KB/sec and 10 documents/sec.
Processor and Memory Scaling
| Number of processors | Memory (MB) | KB2/second | Document3s/second | Total CPU (Average %) | CPU Cost4 |
| 4 | 256 | 30.56 | 10.27 | 46 | 35.8 |
| 4 | 128 | 31.03 | 10.42 | 49 | 37.6 |
| 4 | 64 | 26.35 | 8.52 | 38 | 35.7 |
| 2 | 256 | 29.64 | 9.96 | 57 | 22.9 |
| 2 | 128 | 30.32 | 10.18 | 55 | 21.6 |
| 2 | 64 | 22.44 | 7.52 | 42 | 22.3 |
| 1 | 256 | 21.74 | 7.30 | 69 | 18.9 |
| 1 | 128 | 22.66 | 7.61 | 52 | 13.7 |
| 1 | 64 | 14.49 | 4.87 | 45 | 18.5 |
2. Total number of bytes in crawl space.
3. Number of documents in catalog.
4. CPU cost = (# procs) x (clock speed per proc) x (% total CPU) / (documents/sec).
Based on the data collected in this document, the following assertions can be made about scaling and performance for Site Server Search:
5. Search server loaded with anonymous clients for all results presented in this report unless otherwise indicated.
There is an issue in the released version of Search that limits simultaneous query performance in configurations with very large numbers of catalogs. Search as shipped supports a maximum of 64 connections between the Search collator and all dependent catalogs. Suppose that the number of catalogs created for querying is N and that the typical query latency is L seconds. Then the maximum query rate in this configuration is 64/(NxL) queries per second. The observed query latency while collecting data for this report was typically less than 1 second. For example, given a latency of one second per query, if there are 10 catalogs forming the Search space, then the maximum query rate would be 6.4 queries/second.
A hot fix is currently available which allows the search query rate to run at full speed, independent of the number of catalogs used in the query. To get more information about this fix go to http://support.microsoft.com/support on the Web. Site Server version 3.0 Service Packs containing this fix are also located at this Web site and may be located by clicking on drivers and download and then selecting Service Packs.
This section gives capacity planning guidelines for Search for interactive querying and batch mode querying based on the user profile previously defined. Interactive querying is performed with the hit count on. For interactive querying, the number of recommended servers is given as a function of the number of concurrent users. Batch mode querying is performed with the hit count off. For batch mode querying, the total search time is given as a function of the total number of queries performed and the size of the record set returned. Latency, as measured by the average response time, is given in Appendix B.
The following table shows the number of Pentium Pro clock cycles (in MHz) consumed as a function of the number of concurrent users, and MaxRecord size for interactive querying on 1-processor systems. The total number of MHz consumed is then used to determine the number of 1-processor systems required to support the user profile defined at the beginning of this document. The MHz consumed for each MaxRecord size is determined using Table 14, with the MaxRecord size and corresponding query rate as input. The query rate is determined by multiplying the number of concurrent users by the query rate frequency as given in Table 1. Note that for a given MaxRecord size the MHz consumed as listed in the table is sometimes the same for the first several concurrent user sizes. This is because the computed query rate is smaller than the smallest query rate specified in Table 14 and so the smallest query rate specified is selected in each case. For Information, see “Processor Calculations” in Detailed Discussion of Search Scalability and Performance.
Table 3: 1-Processor
| Concurrent users6 | MaxRecord =20MHz consumed |
MaxRecord =40MHz consumed |
MaxRecord =80MHz consumed |
MaxRecord =200MHz consumed |
Total MHz consumed | Number 1-processor systems |
| 1000 | 31 | 32 | 35 | 59 | 157 | 1 |
| 1500 | 44 | 32 | 35 | 59 | 170 | 1 |
| 2000 | 58 | 32 | 36 | 66 | 192 | 1 |
| 2500 | 71 | 24 | 45 | 84 | 234 | 2 |
| 3000 | 85 | 40 | 54 | 101 | 280 | 2 |
| 3500 | 98 | 46 | 63 | 119 | 326 | 2 |
| 4000 | 112 | 51 | 72 | 136 | 371 | 2 |
| 4500 | 125 | 57 | 81 | 154 | 417 | 3 |
| 5000 | 139 | 62 | 91 | 172 | 464 | 3 |
6. A concurrent user is defined as an active user using the query profile defined at the beginning of this document. Experience shows that typically five percent of users who have access to Search are concurrent users, peaking at up to ten percent. Thus, a 20,000 user company whose users all have access to Search can typically expect a peak concurrent user load of a about 2,000 users.
The following table shows the number of Pentium Pro clock cycles (in MHz) consumed as a function of concurrent users for interactive querying on 2-processor systems. Queries per second in the table are computed using the user profile assumption defined at the beginning of this document.
Table 4: 2-Processors
| Concurrent users7 | MaxRecord =20MHz consumed |
MaxRecord =40MHz consumed |
MaxRecord =80MHz consumed |
MaxRecord =200MHz consumed |
Total MHz consumed | Number 2-processor systems |
| 1000 | 34 MHz | 28 | 34 | 60 | 156 | 1 |
| 1500 | 47 | 28 | 34 | 60 | 169 | 1 |
| 2000 | 61 | 28 | 34 | 68 | 191 | 1 |
| 2500 | 75 | 30 | 46 | 88 | 239 | 1 |
| 3000 | 89 | 36 | 57 | 108 | 290 | 1 |
| 3500 | 103 | 42 | 69 | 128 | 342 | 1 |
| 4000 | 117 | 49 | 81 | 148 | 395 | 1 |
| 4500 | 130 | 55 | 92 | 167 | 444 | 2 |
| 5000 | 144 | 61 | 104 | 187 | 496 | 2 |
7. A concurrent user is defined as an active user using the query profile defined at the beginning of this document. Experience shows that typically five percent of users who have access to Search are concurrent users, peaking at up to ten percent. Thus, a 20,000 user company whose users all have access to Search can typically expect a peak concurrent user load of a about 2,000 users.
The following table shows the query capacity for batch mode querying on 1-processor systems as a function of session length.
Table 5: 1-Processor
| Session length | MaxRecords | Peak query rate | Total queries |
| 30 minutes | 20 | 18.2 | 8190 |
| 40 | 11.8 | 5310 | |
| 80 | 7 | 3150 | |
| 200 | 2.4 | 1080 | |
| 60 minutes | 20 | 18.2 | 16380 |
| 40 | 11.8 | 10620 | |
| 80 | 7 | 6300 | |
| 200 | 2.4 | 2160 | |
| 90 minutes | 20 | 18.2 | 24570 |
| 40 | 11.8 | 15950 | |
| 80 | 7 | 9450 | |
| 200 | 2.4 | 3240 | |
| 120 minutes | 20 | 18.2 | 32760 |
| 40 | 11.8 | 21240 | |
| 80 | 7 | 12600 | |
| 200 | 2.4 | 4320 |
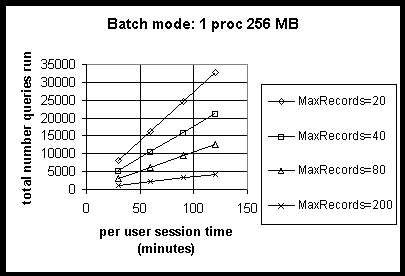
The following graph replicates the preceding table showing the query capacity for batch mode querying on 1-processor systems as a function of session length.
The following table shows the total time required to search for a given number of queries in batch mode on a 1-processor system.
Table 6: 1-Processor
| Number queries | MaxRecords | Peak queries/sec | Total search time (seconds) |
| 1000 | 20 | 18.2 | 55 |
| 40 | 11.8 | 85 | |
| 80 | 7 | 143 | |
| 200 | 2.4 | 417 | |
| 5000 | 20 | 18.2 | 275 |
| 40 | 11.8 | 424 | |
| 80 | 7 | 714 | |
| 200 | 2.4 | 2083 | |
| 10000 | 20 | 18.2 | 549 |
| 40 | 11.8 | 847 | |
| 80 | 7 | 1429 | |
| 200 | 2.4 | 4167 | |
| 15000 | 20 | 18.2 | 824 |
| 40 | 11.8 | 1271 | |
| 80 | 7 | 2143 | |
| 200 | 2.4 | 6250 | |
| 20000 | 20 | 18.2 | 1099 |
| 40 | 11.8 | 1695 | |
| 80 | 7 | 2857 | |
| 200 | 2.4 | 8333 | |
| 25000 | 20 | 18.2 | 1374 |
| 40 | 11.8 | 2119 | |
| 80 | 7 | 3571 | |
| 200 | 2.4 | 10417 | |
| 30000 | 20 | 18.2 | 1648 |
| 40 | 11.8 | 2542 | |
| 80 | 7 | 4286 | |
| 200 | 2.4 | 12500 | |
| 35000 | 20 | 18.2 | 1923 |
| 40 | 11.8 | 2966 | |
| 80 | 7 | 5000 | |
| 200 | 2.4 | 14583 |
The following table shows the query capacity for batch mode querying on 2-processor systems as a function of session length.
Table 7: 2-Processors
| Session length | MaxRecords | Peak query rate | Total queries |
| 30 minutes | 20 | 28.7 | 12915 |
| 40 | 17.5 | 7875 | |
| 80 | 9.9 | 4455 | |
| 200 | 2.4 | 1080 | |
| 60 minutes | 20 | 28.7 | 25830 |
| 40 | 17.5 | 15750 | |
| 80 | 9.9 | 8910 | |
| 200 | 2.4 | 2160 | |
| 90 minutes | 20 | 28.7 | 38745 |
| 40 | 17.5 | 23625 | |
| 80 | 9.9 | 13365 | |
| 200 | 2.4 | 3240 | |
| 120 minutes | 20 | 28.7 | 51660 |
| 40 | 17.5 | 31500 | |
| 80 | 9.9 | 17820 | |
| 200 | 2.4 | 4320 |
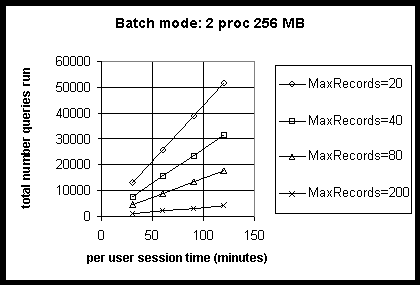
The following graph replicates the preceding table showing the query capacity for batch mode querying on 2-processor systems as a function of session length.
The following table shows the total time required to search for a given number of queries in batch mode on 2-processor systems.
Table 8: 2-Processors
| Number queries | MaxRecords | Peak queries/sec | Total search time (seconds) |
| 1000 | 20 | 28.7 | 35 |
| 40 | 17.5 | 57 | |
| 80 | 9.9 | 101 | |
| 4167 | 2.4 | 417 | |
| 5000 | 20 | 28.7 | 174 |
| 40 | 17.5 | 286 | |
| 80 | 9.9 | 505 | |
| 200 | 2.4 | 2083 | |
| 10000 | 20 | 28.7 | 348 |
| 40 | 17.5 | 571 | |
| 80 | 9.9 | 1010 | |
| 200 | 2.4 | ||
| 15000 | 20 | 28.7 | 523 |
| 40 | 17.5 | 857 | |
| 80 | 9.9 | 1515 | |
| 200 | 2.4 | 6250 | |
| 20000 | 20 | 28.7 | 697 |
| 40 | 17.5 | 1143 | |
| 80 | 9.9 | 2020 | |
| 200 | 2.4 | 8333 | |
| 25000 | 20 | 28.7 | 871 |
| 40 | 17.5 | 1429 | |
| 80 | 9.9 | 2525 | |
| 200 | 2.4 | 10417 | |
| 30000 | 20 | 28.7 | 1045 |
| 40 | 17.5 | 1714 | |
| 80 | 9.9 | 3030 | |
| 200 | 2.4 | 12500 | |
| 35000 | 20 | 28.7 | 1220 |
| 40 | 17.5 | 2000 | |
| 80 | 9.9 | 3535 | |
| 200 | 2.4 | 14583 |
Six parameters were varied to measure the throughput and processor cost for Microsoft® Site Server Search. These variables include:
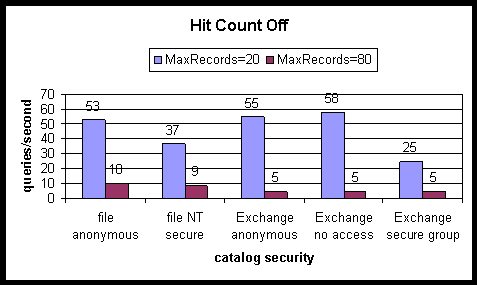
The following charts compare the query rates between secure and non-secure catalogs built from file and Exchange crawls. The Search server consisted of 2-processors with 256 MB of RAM.
Query rates are compared, when searching against a catalog built from Microsoft® Windows® NT secure files and a catalog built from files granting anonymous access. Each NT secure file granted access only to a secure group containing 1,000 users. One of the 1,000 users was selected at random to query the catalog built from NT secure files. Note that, in the case of small numbers of results returned, searching under security with the hit count turned off causes a reduction in the query rate relative to corresponding anonymous search rates.
For comparison purposes, a catalog is first built by crawling Exchange folders, each of which has Client Permissions set to Reviewer for anonymous users. This enables any user performing a search to read the contents of the folder. The query rates in this case are similar to unsecured query rates measured against catalogs built from a file crawl.
Next the effect of searching an Exchange catalog while granting Reviewer client permission to a secure group only is examined. When searching with hit count off and MaxRecords set to 1 there is a fifty-five percent reduction in the query rate relative to unsecured searching with the rate decreasing from 55 queries/second to 25 queries/second. When searching with hit count off and MaxRecords set to 1 there is a twenty-seven percent reduction in the query rate relative to unsecured searching, with the rate decreasing from 15 queries/second to 11 queries/second. As MaxRecords is increased the difference in query rates between this form of secured searching and unsecured searching decreases.
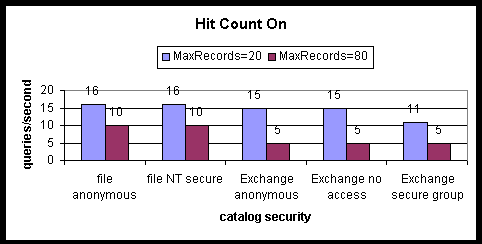
When searching catalogs with security, the time average CPU utilization is lower than when searching catalogs without security. However, more clock cycles are consumed in aggregate.
No measurable impact on query rate was observed as a function of word list length, for lengths up to 325 unique words. In performing a simulated query, a query term is selected at random from a list of words occurring in the catalog. The impact of the size of this list on query rate was tested because of possible performance effects due to caching. This was measured by performing the following test:
The Search Web server is first loaded with users selecting query terms at random from a short list containing 10 unique words. After the start-up cost for running Search has been incurred, a steady-state query rate is achieved.
The Search server is then loaded with additional users selecting query terms at random from a longer list containing 325 unique words. If there had been any measurable effects on query rate due to caching, they would have been manifested during the initial stages of server loading with this second round of users.
This scenario was run on 2-processors with 256 MB of RAM with hit count on and off and for variable record set sizes.
The following graph and table show the peak query rate when querying against catalogs with varying numbers of documents, unique keys, and index sizes on a 2-processor system with either 256 MB of RAM or 128 MB of RAM. All these queries were run with MaxRecords returned set to 1. When the property store size was significantly larger than system RAM size, the peak query rate fell when performing searches with the hit count on. However, it was observed that as MaxRecords is increased, this loss in performance becomes correspondingly less significant.
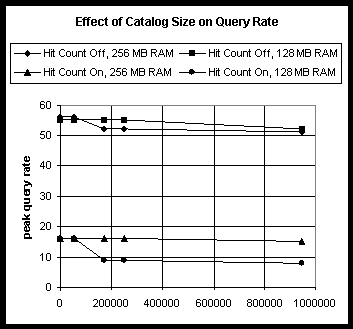
Table 9: Query Rate vs. Catalog Size
| Documents in catalog | Unique keys | Index size (MB) | Property store size (MB) | System MB | Hit Count | Peak Query rate |
| 563 | 2123 | 1 | 3 | 256 | off | 56 |
| on | 16 | |||||
| 128 | off | 55 | ||||
| on | 16 | |||||
| 55405 | 428025 | 24 | 49 | 256 | off | 56 |
| on | 16 | |||||
| 128 | off | 55 | ||||
| on | 16 | |||||
| 170120 | 1406277 | 90 | 145 | 256 | off | 52 |
| on | 16 | |||||
| 128 | off | 55 | ||||
| on | 9 | |||||
| 250768 | 891779 | 226 | 211 | 256 | off | 52 |
| on | 16 | |||||
| 128 | off | 55 | ||||
| on | 9 | |||||
| 947130 | 9803851 | 1352 | 873 | 256 | off | 51 |
| on | 15 | |||||
| 128 | off | 52 | ||||
| on | 8 |
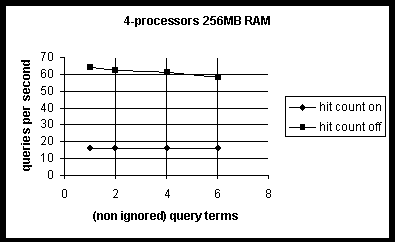
The following graph shows that a reasonable number of terms in a search query does not affect throughput, and was therefore not used in calculating processor cost. More precisely, the Search query rate is not significantly affected by the number of terms in the query unless the Web server is under moderate to heavy load, hit count is off, and the number of (non-ignored) terms in the query is greater than six8.
8. The hit count is turned off by including the logic OptimizeFor="NoHitCount" in the query ASP.
The only two variables used in obtaining processor cost were:
The following tables show processor costs. The first table has the measurements with hit count off, and shows how the cost per search varies as the number of records returned is increased from 1 to 80.
Table 10: Query Rate with Hit Count Off, with Varying Records Returned
| Number of processors | Records returned | Successful queries /sec | CPU cost9 |
| 4 | 1 | 60.3 | 11.2 |
| 10 | 40.2 | 16.7 | |
| 20 | 30.5 | 21.8 | |
| 40 | 20.4 | 27.1 | |
| 80 | 10.1 | 36.4 | |
| 2 | 1 | 56.0 | 6.6 |
| 10 | 37.2 | 9.7 | |
| 20 | 28.7 | 12.7 | |
| 40 | 17.5 | 19.4 | |
| 80 | 9.9 | 34.3 | |
| 1 | 1 | 38.2 | 2.6 |
| 10 | 25.1 | 4.0 | |
| 20 | 18.2 | 5.5 | |
| 40 | 11.8 | 8.5 | |
| 80 | 7.0 | 14.3 |
9. CPU cost = (# procs) x (clock speed per proc) x (% total CPU) / (successful queries / sec).
The following table shows measurements with hit count on, and how the cost per search varies as the number of records returned is increased from 1 to 160.
Table 11: Query Rate with Hit Count On, with Varying Number of Records Returned
| Number of processors | Records returned | Queries /sec | CPU Cost |
| 4 | 1 | 16.0 | 14.0 |
| 20 | 15.9 | 17.1 | |
| 40 | 14.6 | 23.6 | |
| 80 | 9.6 | 38.3 | |
| 160 | 2.9 | 71.7 | |
| 2 | 1 | 16.0 | 12.0 |
| 20 | 16.0 | 17.0 | |
| 40 | 14.7 | 22.3 | |
| 80 | 9.0 | 42.2 | |
| 160 | 2.8 | 65.7 | |
| 1 | 1 | 15.9 | 10.5 |
| 20 | 11.4 | 17.0 | |
| 40 | 7.0 | 26.3 | |
| 80 | 5.4 | 32.6 | |
| 160 | 2.8 | 64.3 |
The following table shows estimated network cost. The variable that affects network cost is the number of records returned. The number of terms sent in the query can also affect network cost, but this is considered negligible and is therefore not taken into account.
Table 12: Percent Network Utilization
| Number of processors | Records returned | Successful queries /sec | Percent network |
| 4 | 1 | 60.3 | 1.7 |
| 10 | 40.2 | 2.1 | |
| 20 | 30.5 | 2.5 | |
| 40 | 20.4 | 2.7 | |
| 80 | 10.1 | 2.8 | |
| 2 | 1 | 56.0 | 1.6 |
| 10 | 37.2 | 1.9 | |
| 20 | 28.7 | 2.2 | |
| 40 | 17.5 | 2.3 | |
| 80 | 9.9 | 2.3 | |
| 1 | 1 | 38.2 | 1.2 |
| 10 | 25.1 | 1.4 | |
| 20 | 18.2 | 1.5 | |
| 40 | 11.8 | 1.7 | |
| 80 | 7.0 | 1.6 |
The network measurements were taken on a 100 MB Ethernet. As can be seen from the preceding table, the network utilization is minimal even at the highest rate of queries per second or the largest number of records returned. Therefore, network will not be a bottleneck unless a very large number of Search servers are deployed on a 10 MB Ethernet network.
The following table shows disk usage for Search. Again, the most relevant variable is the number of records returned.
Table 13: Percent Disk Utilization
| Number of processors | Records returned | Queries /sec | Percent disk |
| 4 | 1 | 60.3 | 0.2 |
| 10 | 40.2 | 0.2 | |
| 20 | 30.5 | 0.2 | |
| 40 | 20.4 | < 0.1 | |
| 80 | 10.1 | < 0.1 | |
| 2 | 1 | 56.0 | 0.2 |
| 10 | 37.2 | 0.1 | |
| 20 | 28.7 | 0.1 | |
| 40 | 17.5 | < 0.1 | |
| 80 | 9.9 | < 0.1 | |
| 1 | 1 | 38.2 | 0.1 |
| 10 | 25.1 | 0.1 | |
| 20 | 18.2 | 0.1 | |
| 40 | 11.8 | < 0.1 | |
| 80 | 7.0 | < 0.1 |
As the preceding table shows, disk utilization is minimal and not a major consideration when deploying Search.
Resource usage calculations are created to determine what it will cost a resource to support a given number of search users. This information can then be used to ascertain the maximum number of users a configuration of resources can support.
Using the Search user profile in Tables 1 and 2, along with the amount of CPU clock cycles consumed as determined by the equations in Table 14, it is possible to project the processor configuration required to support a given number of users. It is also possible to intelligently predict the maximum number of users a particular processor configuration can support.
More specifically, using the interactive querying user profile given in Table 1 and a projected number of concurrent users, you can determine the query rate for each query type listed in Table 1. This process is shown in the next section, entitled “Profile Calculations”. This query rate can be used in Table 14 to compute the amount of processor clock cycles consumed for each query type. If there are N types of queries forming the user profile and each such query costs Pi clock cycles, then the total number of clock cycles consumed for that particular user profile is given by:
P1 +…+Pi +…+PN.
This will determine the number of servers required to support the given user profile for a given number of concurrent users.
It is difficult to determine maximum capacity based on the number of concurrent users without taking into consideration user behavior. Once logged on, how long will a user remain on the site? How many searches will be performed and how will they be composed? These questions are answered in the user profile in Tables 1 and 2. This section will focus on interactive querying using the profile from Table 1.
The user profile in Table 1 indicates that each online user connection will consist of a total of six searches over a period of 30 minutes. Table 1 illustrates the distribution of online searches performed, shows how each type of search is executed over the 30-minute session and determines the query frequency per user for each value of MaxRecords. For example, in the case where MaxRecords=20, since there are 3 queries performed per user over the duration of the 30-minute session, the query frequency is given by (3 queries / 30 minutes) which equals 0.001667 queries/second/user.
Based on this information, the total number of searches per second, given some number of concurrent users, is shown by
R = N × F
where
R = total searches per second
N = number of concurrent users and
F= frequency (searches per second per user).
For example, from the user profile in Table 1, with MaxRecords=20, F=0.001667. If, in this instance, there are 2,000 concurrent users, the total number of searches per second is given by
R = 2000 × 0.001667 = 3.3 searches/second.
Similar procedures can be followed for batch mode calculations.
The following table defines equations which determine the total number of processor clock cycles consumed (in Pentium Pro megahertz) as a function of query rate, and is specific to:
In particular, the total number of processor clock cycles consumed is described by an nth degree polynomial with coefficients C0, C1,…,Cn given in the following table, and is defined over a specific query rate range [Rmin,Rmax]. This polynomial has the form:
C0+C1 x R+…+Cn x Rn
R is the query rate, and Rmin and Rmax are the minimum and maximum query rates over which the equations are defined.
For example, suppose you wish to calculate the clock cycle consumed for a search query transaction on a 4-processor system with no hit count returned and a maximum return record set size of 80 records. From row four in the following table, the polynomial corresponding to this particular choice is of the 3rd degree with coefficients C0=14.67842, C1=13.52971, C2=0.48375, and C3=0.01654. If you require your server to sustain a total query rate of 7.0 queries per second, then the total number of clock cycles consumed is given by:
14.67842+13.52971 x 7.0+0.48375 x (7.0)2+0.01654 x (7.0)3 = 139 MHz.
Note that the query rate used in these calculations must lie within the query rate range [Rmin, Rmax] defined in the following table for each equation.
Now suppose, given a particular search community profile, that the search query rate required R is less than the minimum query rate Rmin. In this case you would use Rmin instead of R for the calculations.
For example, suppose you wish to calculate the clock cycles consumed for a search query transaction on a 2-processor system with a hit count returned and a maximum return record set size of 20 records. From the following table, the query rate range corresponding to this particular choice is [1.3,16.0]. That is, Rmin=1.3 and Rmax=16.0. If you require your server to sustain a total query rate R=0.9 queries/sec, then because R<Rmin you must take R=1.3 instead of R=0.9. So in this case the total number of clock cycles consumed is given by:
5.87428+16.59980 x 1.3 = 27 MHz.
Finally, for single-server configurations, Search does not support query rates R greater than Rmax. If R>Rmax, then a multiple-server configuration will be required.
Table 14: Processor Equations which Compute Number of Pentium Pro Clock Cycles (in MHz) Consumed as a Function of Search Queries Per Second. Each Equation is Defined over a Particular Range of Query Rates.
| Transaction | Processors | Transaction Control | Transaction rate range | Polynomial degree | Polynomial coefficients |
|
| HitCount returned | Max Records | |||||
| Search | 4 | Off | 1 | [3,59] | 4 | 16.67309, 1.17374, 0.82320, -0.03109, 0.00035 |
| 10 | [3,40] | 4 | 27.29172, 1.10753, 0.94132, -0.03916, 0.00063 | |||
| 20 | [3,31] | 4 | 25.30815, 1.18427, 1.93691, -0.10960, 0.00221 | |||
| 40 | [3,21] | 3 | 14.67842, 13.52971, 0.48375, 0.01654 | |||
| 80 | [2.5,11] | 1 | -62.92596, 50.03780 | |||
| 200 | [1.5,3] | 1 | -84.95238, 102.85714 | |||
| 2 | 1 | [3.3,56] | 1 | 3.88275, 6.38717 | ||
| 10 | [3.8,37.2] | 1 | -0.48084, 9.52619 | |||
| 20 | [3.7,28.7] | 1 | -1.55814, 12.60938 | |||
| 40 | [3.4,17.5] | 1 | -6.31469, 19.72028 | |||
| 80 | [2.5,9.9] | 1 | -20.34564, 36.66846 | |||
| 200 | [1.9,2.4] | 1 | -35.00000, 80.00000 | |||
| 1 | 1 | [3.3,38.2] | 1 | 4.31634, 5.13551 | ||
| 10 | [3.3:25.1] | 1 | 5.22069, 7.80784 | |||
| 20 | [3.3,18.2] | 1 | 6.31572, 10.67157 | |||
| 40 | [3.3,11.8] | 1 | 5.59860, 16.57680 | |||
| 80 | [2.5,7.0] | 1 | 9.24883, 27.50907 | |||
| 200 | [1.6,2.4] | 1 | 12.38596, 54.73684 | |||
| 4 | On | 1 | [1.2,16] | 1 | 1.78439,13.76549 | |
| 20 | [1.3,15.9] | 1 | 3.26939, 18.88030 | |||
| 40 | [1.3,15.9] | 1 | -2.17235, 23.95998 | |||
| 80 | [1.1,9.2] | 1 | 3.43099, 46.50116 | |||
| 200 | [1.0,2.3] | 1 | -8.12245, 71.83673 | |||
| 2 | 1 | [1.2,16] | 1 | 11.73375, 10.79324 | ||
| 20 | [1.3,16] | 1 | 5.87428, 16.59980 | |||
| 40 | [1.3,14.7] | 1 | -2.04955, 22.76778 | |||
| 80 | [1.1,9] | 1 | -12.72356, 42.05937 | |||
| 200 | [1.0,2.3] | 1 | -11.17900, 71.40811 | |||
| 1 | 1 | [1.3,15.9] | 1 | 13.63422,9.76872 | ||
| 20 | [1.2,11.4] | 1 | 4.10199, 16.15339 | |||
| 40 | [1.3,8.4] | 1 | 6.06591, 20.371934 | |||
| 80 | [1.1,5.4] | 1 | -0.88875, 32.75249 | |||
| 200 | [1.0,2.3] | 1 | -4.18138, 63.29356 | |||
From the network usage Table 12, you can see that the highest network utilization is approximately three percent of a 100 MB Ethernet. This translates to about 3 MB per server at peak. Therefore, a 3 MB overhead should be added for each additional server running at peak. For servers running below peak, the appropriate adjustment should be made.
Note that the three percent is taken with hit count off. This will rarely be the case in online transactions. Hit count on the network utilization will be much lower. Therefore, if hit count is on, plan on about 1 MB maximum per server.
Disk costs are not significant, as shown in the disk usage Table 12. Even at the highest query rate, disk utilization is less than one percent. No disk calculations are necessary to run Search Server optimally.
The following example illustrates how to determine a Search configuration for a given number of users. Utilizing the user profile in Table 1, you will add additional information regarding the search community for both interactive and batch mode query sites.
Interactive query site:
20,000 total users
Each user connects for 30 minutes (session time) and performs three10 queries with hit count on and MaxRecords=20.
10. The number of queries per user used here is for the case MaxRecords=20. The query rate calculation is computed similarly for the different values of MaxRecords given in the user profile.
10% of total users querying simultaneously at peak time = 2,000 concurrent users
Total queries per second during peak time = (2,000 users) x (3 queries/user) / (30 minutes) = 3.3 queries/sec
Batch mode query site:
20,000 total users
Each user connects for 100 minutes (session time) and performs 4 queries with hit count off and MaxRecords=20.
30% of total users signed up for delivery at peak time = 6,000 simultaneous users
Total queries per second during peak time = (6,000 users) x (4 queries/user) / (100 minutes) = 4.0 queries/sec
The number of queries per second denoted by R is given by:
R = N x F
Where the number of concurrent (simultaneous) users N is computed as shown previously, and the frequency F is the number of queries per second per user per session as shown in Tables 1 and 2.
The following table shows the query rate the Web server must sustain for interactive and batch mode queries in order to support the example search community described above.
Table 15: Query Transactions for Each Sample Site
| Query type | Query composition | N = # users | F = frequency | R= queries per second |
| Interactive | MaxRecords=20
Hit Count On |
2000 | 0.001667 | 3.3 |
| MaxRecords=40
Hit Count On |
2000 | 0.000556 | 1.1 | |
| MaxRecords=80
Hit Count On |
2000 | 0.000556 | 1.1 | |
| MaxRecords=200
Hit Count On |
2000 | 0.000556 | 1.1 | |
| Batch mode | MaxRecords=20
Hit Count Off |
6000 | 0.000667 | 4.0 |
You can compute the number of Web server processor clock cycles consumed for each query type described previously. Note that each search type (interactive or batch mode) is taken in the previous example as a combination of query transactions, each with its own active server page (ASP). The model developed to predict clock cycles consumed is limited to single ASP transactions. Therefore, in order to compute clock cycles consumed for interactive and batch mode queries, the clock cycles consumed for each individual ASP transaction must first be computed separately. The final number of clock cycles consumed is determined by adding these individual transaction costs. Note that this assumes that the combined number of clock cycles consumed is linearly related to individual clock cycles consumed. On multiprocessor systems, however, this linearity can break down in transaction regimes with high rates of context switching, and this behavior may reduce the accuracy of each equation.
Equations that determine clock cycles consumed are given as a function of query rate and defined separately depending on the number of processors, the number of records returned, and whether the hit count is desired. Furthermore, each equation is defined over a particular range of query rates.
In the following example, suppose you are interested in computing the total number of clock cycles consumed for interactive and batch mode queries on 2-processor systems. This quantity is denoted by P. The equations for interactive mode queries as shown in Table 15 are given by:
(1a) PHit Count On, MaxRecords=20 = 5.87+16.60 x R, 1.3<= R<=16.0
(1b) PHit Count On, MaxRecords=40= -2.05+22.77 x R, 1.3<=R<=14.7
(1c) PHit Count On, MaxRecords=80= -12.72+42.06 x R, 1.1<=R<=9.0
(1d) PHit Count On, MaxRecords=200= -11.18+71.41 x R, 1.0<=R<=2.3
The equation for batch mode queries as shown in Table 15 is given by:
(2) PHitCount Off, MaxRecords=20 = -1.56+12.61 x R, 3.7<=R<=28.7.
Now, from Table 15, with hit count on and MaxRecords=20, you have R=3.3.
So for equation (1a):
P = 5.87+16.60 x 3.3 = 61 MHz.
Next, for the case with MaxRecords=40 you have R=1.1, which is less than Rmin =3 in equation (1b). Therefore, you use R=1.3.
So for equation (1b):
P = -2.05+22.77 x 1.3 = 28 MHz.
With MaxRecords=80 and MaxRecords=200, you have R=1.1, as well.
So for equation (1c):
P = -12.72+42.06 x 1.1 = 34 MHz,
and for equation (1d):
P = -11.18+71.41 x 1.1 = 67 MHz.
Therefore, the total number of clock cycles consumed for this interactive mode is given by:
Pinteractive mode = 61 MHz +28 MHz + 34 MHz + 67 MHz = 190 MHz.
Following the same procedure as for the interactive query calculation, the number of clock cycles consumed for batch mode queries comes to:
Pbatch mode = -1.56+12.61 x 4.0 = 49 MHz.
To determine the cost per transaction for Search, transactions are executed (using the InetMon load generator) to exercise computer resources. For each transaction type, the total Pentium Pro Equivalent Megahertz (PPEM) used is noted and the cost per transaction obtained by dividing the total PPEM by the number of transactions per second. To ensure that transaction cost reflects maximum achievable transaction rate, user load is increased gradually until capacity is reached. In order to minimize the impact of context switching on PPEM, transaction rates that show more than 15,000 context switches are discarded when possible.
To ensure that calculated transaction costs were within a reasonable range, a final test was run with a mix of transaction types. Then the results of this test were compared with the calculated results from the transaction costs.
To ensure that predicted search query costs were within a reasonable margin of error of observed search query costs, a final test was run with a mix of transaction types.
The verification test is based on a profile similar to that shown in Table 1. An InetMonitor script was used to simulate the query profile. For all verification tests, we assumed that each user made four queries over a 10-minute period. For the 1-processor test case we arbitrarily assumed that sixty percent of the time each user requested 20 records be returned per query, and that the remaining forty percent of the time each user requested 80 records be returned per query. For the 2-processor test case we arbitrarily assumed that fifty percent of the time each user requested 20 records be returned per query, and that the remaining fifty percent of the time each user requested 80 records be returned per query. Appendix E gives the InetMonitor scripts which correspond to these transactions.
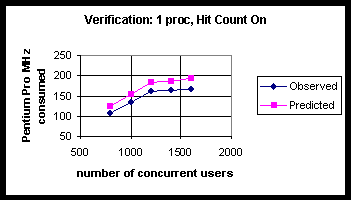
Table 16: Latency (as Measured by Average Query Response Time in Milliseconds) and Observed vs. Predicted Pentium Pro Clock Cycles (in MHz) Consumed for 1-Processor with Hit Count On.
| Number users | Avg. query response time (ms) | Queries /sec | % proc utilization | Observed PPro MHz consumed | Predicted PPro MHz consumed |
| 800 | 563 | 5.3 | 53 | 106 | 124 |
| 1000 | 595 | 6.6 | 67 | 134 | 153 |
| 1200 | 825 | 7.9 | 80 | 160 | 183 |
| 1400 | 916 | 8 | 82 | 164 | 185 |
| 1600 | 950 | 8.3 | 83 | 166 | 192 |
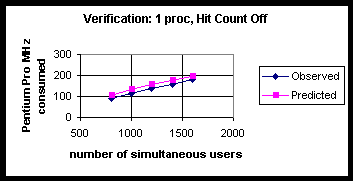
Table 17: Latency (as Measured by Average Query Response Time in Milliseconds) and Observed vs. Predicted Pentium Pro Clock Cycles (in MHz) Consumed for 1-Processor with Hit Count Off.
| Number users | Avg. query response time (ms) | Queries /sec | % proc utilization | Observed Pro MHz consumed | Predicted Pro MHz consumed |
| 800 | 46 | 6 | 45 | 90 | 107 |
| 1000 | 47 | 6.7 | 57 | 114 | 132 |
| 1200 | 47 | 8 | 68 | 136 | 155 |
| 1400 | 47 | 9.3 | 79 | 158 | 176 |
| 1600 | 47 | 10.6 | 91 | 182 | 197 |
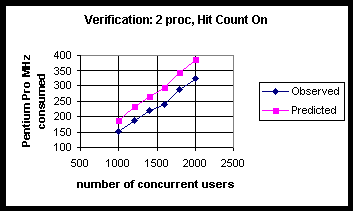
Table 18: Latency (as Measured by Average Query Response Time in Milliseconds) and Observed vs. Predicted Pentium Pro Clock Cycles (in MHz) Consumed for 2-Processors with Hit Count On.
| Number users | Avg. query response time (ms) | Queries /sec | % proc utilization | Observed PPro MHz consumed | Predicted PPro MHz consumed |
| 1000 | 550 | 6.6 | 38 | 152 | 187 |
| 1200 | 556 | 8.1 | 47 | 188 | 231 |
| 1400 | 572 | 9.3 | 55 | 220 | 265 |
| 1600 | 573 | 10.2 | 60 | 240 | 293 |
| 1800 | 640 | 11.9 | 72 | 288 | 342 |
| 2000 | 863 | 13.3 | 81 | 324 | 383 |
Table 19: Latency (as Measured by Average Query Response Time in Milliseconds) and Observed vs. Predicted Pentium Pro Clock Cycles (in MHz) Consumed Shown for 2-Processors with Hit Count Off.
| Number users | Avg. query response time (ms) | Queries /sec | % proc utilization | Observed PPro MHz consumed | Predicted PPro MHz consumed |
| 1000 | 64 | 6.7 | 34 | 136 | 143 |
| 1200 | 73 | 8 | 42 | 168 | 175 |
| 1400 | 74 | 9.3 | 49 | 196 | 207 |
| 1600 | 105 | 10.5 | 56 | 224 | 237 |
| 1800 | 174 | 12 | 68 | 272 | 274 |
| 2000 | 302 | 13.3 | 80 | 320 | 305 |
This appendix shows how the Search server behaves with 1-, 2-, and 4-processors. There are two factors that affect the Search server in general: number of records returned and whether hit count is on or off.
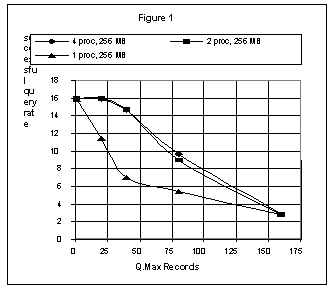
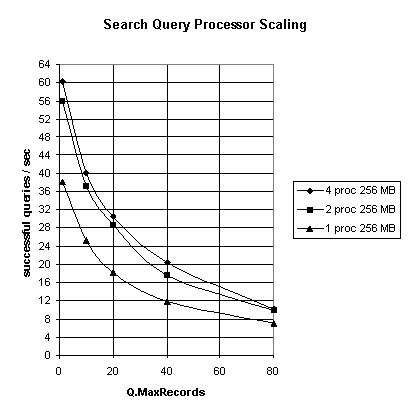
The first two graphs show scaling from 1- to 2- to 4-processors when the number of records returned is varied.
In the first graph, with hit count on, the 1-processor system shows a steep decline as the records returned is increased, while the 2- and 4-processor systems are almost identical and show a linear decline as the number of records returned is increased.
Queries Per Second (Hit Count On) with Varying Number of Records Returned
In the next graph, with Hit Count Off, the 2-processor system shows an appreciable improvement in query rate over a 1-processor system. However, there is negligible improvement when going to 4-processors.
Queries Per Second (Hit Count Off) with Varying Number of Records Returned
All counters noted can be found in PerfMon. The Crawl and Search-related counters in the Site Server Gatherer, Site Server Indexer, and Site Server Search Catalog objects can be used to capture profile information, as well as usage trends.
The counters in the system, memory, network segment, and physical disk objects can be used to monitor capacity. Note that the InetMonitor tool is capable of monitoring these counters automatically. Furthermore, InetMonitor will issue a warning when hardware resources are being overutilized. Specifically, Search is principally CPU bound, so when CPU utilization reaches eighty percent for a sustained period of time, InetMonitor issues a warning.
Crawl in progress flag
Documents successfully filtered rate
Build in progress
Number of documents
Active threads
Average response time
Successful query rate
Percentage of total processor time
Context switches per second
Pages per second
Available bytes
Bytes received per second
Bytes sent per second
Percentage of disk time
The following is an example of the kind of script used for Search verification, and represents the behavior of a single user. The user performs four queries over a 10-minute period, choosing equally betweensearch1.asp and search2.asp. These ASPs are where the hit count flag and record set size are determined. In particular, if no hit count is desired, then OptimizeFor=”NoHitCount” is placed in the ASP, and the size of the result set returned is controlled by MaxRecords=<size of result set>.
REM RANDLIST randomly selects a query term from the text file <.\list.txt> containing over 100 words from the catalog index.
REM SLEEP = 10 minutes per user / four queries per user = 150000 ms (from the user profile).
REM Used if searching with security selecting at random from a list of 1000 authenticated users.
REM USER tstRANDNUMBER(1,1000) password.
LOOP 4
%50 SKIP 2
GET url:/search1.asp?qu=RANDLIST(.\list.txt)&ct=catalog_name
SKIP 1
GET url:/search2.asp?qu=RANDLIST(.\list.txt)&ct=catalog_name
SLEEP 150000
ENDLOOP
Increasing the search thread pool size in the registry from eight to 16 increased the query rate by fifty-six percent (from 16 queries/sec to 25 queries/sec) only in the special case where the Web server is under moderate to heavy load, the hit count is computed, and MaxRecords=1. In this case, the latency (average response time) is reduced forty-seven percent, from 962 milliseconds to 506 milliseconds. As MaxRecords is increased, the increase in the query rate for the 16-threaded case relative to the 8-threaded case begins to diminish because of increasing context switching rates. When MaxRecords=50, the increase in the query rate is negligible with sustained context switching rates on the order of 20K/sec.
| Hit count computed | Threads | Q.Max Records | Clients | % CPU | Context switches /sec | % active threads | Thread queue | Avg. response time | Successful queries /sec |
| True | 8 | 1 | 1 | 2 | 674 | 8 | 0 | 496 | 1.2 |
| 8 | 1 | 20 | 20 | 1885 | 100 | 4.4 | 962 | 16 | |
| 16 | 1 | 20 | 42 | 5019 | 76 | 0 | 506 | 25 | |
| 8 | 50 | 1 | 4 | 678 | 7 | 0 | 540 | 1.2 | |
| 8 | 50 | 20 | 47 | 2786 | 100 | 7.4 | 1052 | 14.6 | |
| 16 | 50 | 20 | 82 | 19125 | 82 | 0.4 | 845 | 15.0 | |
| False | 8 | 1 | 1 | 3 | 826 | 0 | 0 | 4.7 | 3.3 |
| 8 | 1 | 20 | 80 | 11234 | 22 | 0 | 22 | 62 | |
| 8 | 50 | 1 | 9 | 851 | 0 | 0 | 52 | 3.4 | |
| 8 | 50 | 20 | 58 | 9824 | 28 | 0 | 112 | 16.5 |
Information in this document, including URL and other Internet web site references, is subject to change without notice. The entire risk of the use or the results of the use of this resource kit remains with the user. This resource kit is not supported and is provided as is without warranty of any kind, either express or implied. The example companies, organizations, products, people and events depicted herein are fictitious. No association with any real company, organization, product, person or event is intended or should be inferred. Complying with all applicable copyright laws is the responsibility of the user. Without limiting the rights under copyright, no part of this document may be reproduced, stored in or introduced into a retrieval system, or transmitted in any form or by any means (electronic, mechanical, photocopying, recording, or otherwise), or for any purpose, without the express written permission of Microsoft Corporation.
Microsoft may have patents, patent applications, trademarks, copyrights, or other intellectual property rights covering subject matter in this document. Except as expressly provided in any written license agreement from Microsoft, the furnishing of this document does not give you any license to these patents, trademarks, copyrights, or other intellectual property.
© 1999-2000 Microsoft Corporation. All rights reserved.
Microsoft, Windows and Windows NT are either registered trademarks or trademarks of Microsoft Corporation in the U.S.A. and/or other countries/regions.
The names of actual companies and products mentioned herein may be the trademarks of their respective owners.