

The purpose of capacity planning for Internet services is to enable Internet site deployments that accomplish the following:
Conventional solutions to capacity planning often attempt to cost Internet services by extrapolating generic benchmark measurements. To better meet the stated objectives of capacity planning, a methodology based on Transaction Cost Analysis (TCA) has been developed at Microsoft for estimating system capacity requirements.
Client transactions are simulated on the host server by a load generation tool that supports standard network protocols. By varying the client load, transaction throughput is correlated with resource utilization over the linear operating regime. A profile is then defined based on anticipated user behavior. This usage profile determines the throughput target and other important transaction parameters from which resource utilization and capacity requirements are then calculated.
Conventional approaches to capacity planning often involve benchmarking the maximum workload of some specific combination of services, each with a particular usage profile on specific hardware. This process is incomplete and time-consuming, because it is not practical to iterate through all possible hardware, service, and usage profile permutations. A common response to this limitation is to determine these benchmarks for only a moderate number of representative deployment scenarios, and then attempt to estimate costs by extrapolating these benchmarks to fit each particular deployment scenario. This approach also increases the risk of over-provisioning hardware, because these benchmarks are designed to capture only the maximum workload attainable.
Transaction Cost Analysis (TCA) attempts to reduce the uncertainty inherent in this process by providing a framework for estimating each resource cost as a function of any usage profile, service mix, or hardware configuration. Hardware resources include, but are not necessarily limited to, CPU, cache, system bus, RAM, disk subsystem, and network. By using TCA methodology, the potential for over-provisioning hardware is also reduced, because the entire (linear) workload range is measured. Finally, unlike some code profiling techniques, TCA captures all costs present during run time, such as operating system overhead.
Figure 1: Comparison between a Conventional Approach and TCA
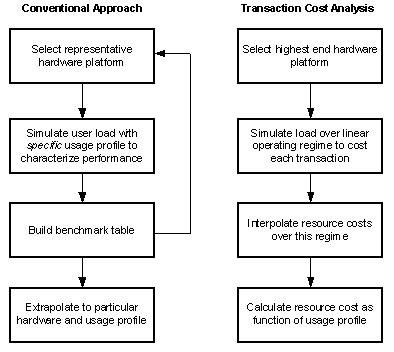
The TCA methodology is applicable to any client-server system, but this paper will focus on its application to Internet services.
Two references, Capacity Planning and Performance Modeling (From Mainframes to Client-Server Systems, Daniel Menasce, Virgilio Almeida, and Larry Dowdy, Prentice Hall, 1994) and Modeling Techniques and Tools for Computer Performance Evaluation, Ramon Puigjaner and Dominique Potier, Plenum Press, 1989, focus on capacity and performance modeling in general. Another reference, Configuration and Capacity Planning for Solaris Servers (Brian Wong, Prentice Hall, February 1997) focuses on capacity planning for Sun Solaris systems, but offers helpful general insight as well.
TCA can be used to detect code bottlenecks and for capacity planning. In many cases, it is used for both purposes simultaneously, allowing the last code iteration to have accompanying capacity information. This paper only discusses using TCA for capacity planning. For simplicity, the methodology presented here assumes that the service analyzed has no code bottleneck (and scales approximately linearly in implementation) and that the hardware bottleneck resides on the hardware running this service.
The effectiveness and flexibility of the capacity planning model depends on a careful assessment of the expected usage profile for each service. This usage profile consists of both individual and aggregated user behavior, and site profile information. Analysis of transaction logs of similar services provides a helpful starting point for defining this profile. Characteristics derived from this profile are then used to establish performance targets.
A representative site profile must be defined that specifies the following:
This deployment configuration should include the servers where each software component will reside.
| Notation | Definition |
| i = 1,…,I | Services deployed |
| Ni | Number of users concurrently connected to service i at peak |
An Internet Service Provider may be interested in deploying a Web hosting platform that supports browsing of subscriber Web pages through the Internet. Suppose that this platform provides subscribers with use of a File Transfer Protocol (FTP) service to control file transfer of these Web pages to and from the host site.
The services required to support this scenario consist of Web (HTTP), FTP, directory (for example, LDAP), and database (for example, SQL Server) services. The Web and FTP services are configured on front-end servers while the directory and database services may each reside on separate back-end servers. In order to simplify subsequent discussion of this example, suppose that only the Web and FTP services are analyzed.
Individual user behavior must be characterized to include the following:
| Notation | Definition |
| j = 1,…,J | Transactions |
| ti | User session time for service i |
| ni,j | Number of transactions j per user session for service i |
Continuing with the previous example, if it is anticipated that of all possible FTP transactions only “delete,” “get,” “open,” and “put” will generate the most significant load in aggregate, then only these transactions need be considered. In particular, FTP “open” may stress a directory service such as LDAP and its database back end if the connection requires an authentication sequence. FTP “get” and “put” may stress disk input/output (I/O) resources and saturate network capacity while FTP “delete” may only stress disk I/O resources, and so on. Similar deductions are made for HTTP “get.” Therefore, the fundamental transactions for this analyses consist of “delete,” “get,” “open,” and “put” for FTP, and “get” for HTTP.
Clearly, the size of files transferred or deleted using FTP, and the Web page size requested using HTTP are important transaction parameters.
The performance targets consist of the minimum required transaction throughput and maximum acceptable transaction latency. The minimum throughput (transaction rate) of transaction j for service i required to support this usage profile is given by:
Ti j = ni,j Ni / ti.(1)
Suppose the Internet site has one million Web hosting subscribers and that 0.1 percent are concurrently using FTP at peak. Further, suppose that the total Web page audience is 2 million users with 0.9 percent users concurrently browsing Web pages at peak. If each Web user performs 5 HTTP “get” operations over 10 minutes, and each FTP user performs 3 FTP “put” and 2 FTP “get” operations together over 5 minutes, then using the notation:
NHTTP = 9000 concurrent usersNFTP = 1000 concurrent users
tHTTP = 10 minutestFTP = 5 minutes
nHTTP,get = 5nFTP,put = 3
nFTP,get = 2
so that:
THTTP,get = 75 HTTP gets/secTFTP,put = 10.0 FTP puts/sec
TFTP,get = 6.7 FTP gets/sec.
Transaction Cost Analysis (TCA) requires correlating resource utilization with service run-time behavior. Although adequate instrumentation to enable measurement of resource utilization is often already built into the operating system, the metrics to measure the performance of service transaction characteristics must also be defined and then built into the probing apparatus. Figure 2 illustrates the intended purpose of these probes in the context of capacity planning and performance management.
Figure 2: The Purpose of Probes in Capacity Planning and Performance Management
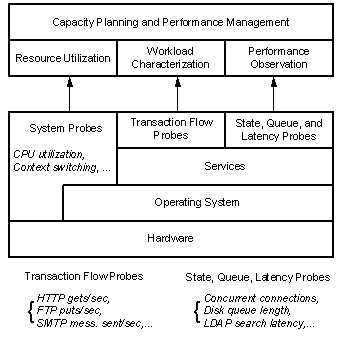
Microsoft® Windows NT® Performance Monitor is equipped with probes (called counters) that measure resource utilization and other system parameters as well as transaction flow, state, queue, and latency parameters for each service. Some Performance Monitor counters commonly collected during TCA (and as part of regular performance monitoring) include:
These include processor utilization, context switching rate, processor and disk queue lengths, disk read and write rates, available memory bytes, memory allocated by process, cache hit ratios, network utilization, network byte send and receive rates, and so on.
These include transaction rates such as HTTP gets/sec, FTP puts/sec, LDAP searches/sec, and so on.
These include concurrent connections, cache hit ratios (for example, for LDAP and SQL Server transactions), queue length, and latency within each service component, and so on.
See the Microsoft Windows NT Resource Kit (Microsoft Press, 1996) for more specific examples of Windows NT counters.
In order to leverage TCA measurements made with one hardware configuration into variable configuration contexts, it is advantageous to separate service components among servers as much as possible. In an uncached environment, this enables better isolation of resource costs for each transaction as a function of each component servicing the transaction.
This notion is illustrated in Figure 3, which shows the propagation of a single transaction (for example, LDAP “add”) between client and servers and its accumulated resource costs C1 on Server 1 (LDAP Service running here) and C2 on Server 2 (SQL Server running here).
Figure 3: Separating Resource Costs of Service Components by Server
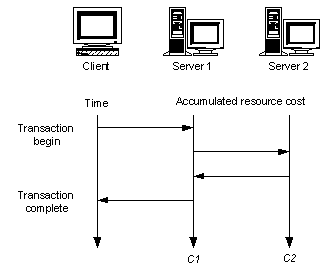
If all of the components servicing this transaction reside on a single server for a particular deployment, then these separate costs may be added together as C1+C2 in order to roughly estimate the integrated cost. Of course, certain performance properties will change in this case. For example, certain costs will disappear, such as the CPU overhead for managing the network connection. On the other hand, other costs may increase, such as disk I/O, because the capacity for caching transaction requests is diminished (which reduces throughput), and so on. When caching plays a particularly important role, variable configurations should be separately analyzed.
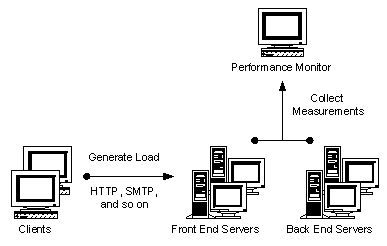
As illustrated in Figure 4, the load generation clients and performance-monitoring tools should reside on computers other than the servers under analysis in order to minimize interference with these servers.
Figure 4: Hardware Configuration for Performance Analysis
The service configuration should be deployed with the highest performance hardware available. This helps to ensure that resource requirements based on measurements on higher-performance hardware will scale down (at worst linearly) to lower-performance hardware. The converse is not necessarily true, however.
For example, multi-processor scaling is often sub-linear, in which case total CPU costs on a 4-way SMP server may be greater than on a 2-way SMP server under the same load (due to additional context switching and bus management overhead). Suppose CPU costs are measured on a 500 MHz 4-way SMP server and the actual deployment hardware consists of a 300 MHz 2-way SMP server. Then if all other hardware characteristics remain unchanged, CPU requirements should increase by no more than a factor of 3.3 = (500 MHz/300 MHz)*(4 processors/2 processors).
Load generation scripts must be written to simulate each transaction separately, and have the following form:
do transaction
sleep rand timeInterval
The sleep is intended to reduce load on the client queue, and timeInterval should be chosen randomly (The Benchmark Handbook for Database and Transaction Processing Systems, Jim Gray, Morgan Kaufman Publishers, 1991) over a representative range of the client-server transaction latencies. The load must be distributed among enough clients to prevent any single client from becoming its own bottleneck.
Before each run, the system should be shut down to flush caches and otherwise restore the system to a consistent state for data collection consistency. Furthermore, each run should continue for at least long enough to reach run-time “steady-state.” This state is reached when, for example, initial transient (start-up) costs are absorbed, network connections are established, caches are populated as appropriate, and periodic behavior is fully captured. The measurements collected for each run should be time averaged over the length of the run in “steady-state.”
In addition to collecting measurements of resource utilization and throughput, counters that help to isolate points of contention in the system should be monitored. These include queue lengths, context switching, out of memory paging, network utilization, and latencies. In particular:
For performance considerations specific to Microsoft Windows NT, see Netfinity Performance Tuning with Windows NT 4.0.(David Watts, M.S. Krishna, et al., IBM Corporation, October 1998).
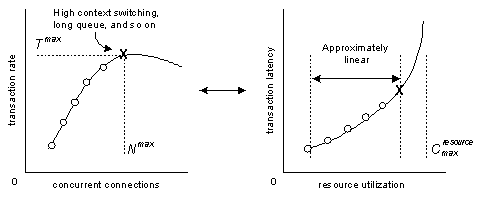
The user load (concurrent connections) should start small and increase incrementally up to Nmax at which point the transaction throughput begins to decrease from its maximum at Tmax. This decrease in throughput is due to factors such as high rates of context switching, long queues, and out of memory paging, and often corresponds to the point at which transaction latency becomes nonlinear.
These relationships are depicted in Figure 5. Each circle and the “X” in this figure represent a run and are points at which data is collected during the load generation. Cmaxresource denotes the maximum resource capacity.
Figure 5: Performance Measurement over the Linear Operating Regime (Generating load beyond maximum throughput corresponds to the point at which transaction latency becomes nonlinear)
Each measured transaction rate Ti , j corresponds to some measured utilization of each resource denoted by Ci , j resource. These data point pairs are interpolated over the linear operating regime to construct an analytic relationship that expresses this resource utilization as a function of transaction rate. This relationship is shown in Figure 6.
| Notation | Definition |
| Ci , j resource | Resource cost of transaction j for service i |
| Ci , j CPU | CPU cycles consumed (MHz) |
| Ci , j reads | Number of disk reads/sec |
| Ci , j writes | Number of disk writes/sec |
| Ci , j RAM | RAM consumed (MB) |
| Ci , j network | Network bandwidth consumed (MB/sec) |
For example, Ci , j CPU(Ti , j ; other) denotes the number of CPU cycles consumed by transaction j for service i with transaction rate Ti , j where other is a placeholder for other transaction parameters, for example, file size for HTTP “get.”
Figure 6: Cost Equations Constructed by Interpolation of Resource Costs as a Function of Throughput (Transaction Rate)
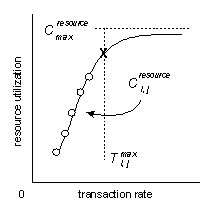
Strictly speaking, Ci , j resource is defined over the transaction rate range 0 ≤ Ti,j ≤ Ti, j max, but if Ti,j > Ti,jmax then the equation for Ci , j resource may still be applied with the interpretation that hardware will need to be scaled up linearly. In this case, it is especially important that the TCA assumptions listed at the beginning of the “Transaction Cost Analysis Methodology” section be satisfied for this interpretation to be valid.
It is assumed that resource utilization adds linearly in a mixed environment in which multiple services are running and multiple transactions are being processed by each service. The total cost for each resource and for all transactions is then given by
Ctotal resource = Σi=1I Σj=1J Ci , j resource(Ti , j ; other)(2)
For performance reasons and in order to account for unexpected surges in resource utilization, it is advantageous to operate each resource at less than full capacity. A threshold factor for each resource is introduced to reflect this caution in the provisioning of resources. This factor represents the percentage of resource capacity that should not be exceeded.
| Notation | Definition |
| 0 < θCPU < 1 | CPU utilization threshold factor |
| 0 < θ reads < 1 | Disk read rate threshold factor |
| 0 < θwrites < 1 | Disk write rate threshold factor |
| 0 < θnetwork < 1 | Network utilization threshold factor |
Therefore, the total number processors required to support this transaction mix without exceeding the CPU utilization threshold is given by:
CtotalCPU / ( θCPU CmaxCPU )(3)
where CmaxCPU cycles denotes the peak clock speed per processor. θCPU is typically chosen between 60 percent and 80 percent.
Similarly, the total number of spindles required is given by:
Ctotal reads / (θ reads Cmaxreads) + Ctotalwrites / (θwrites Cmaxwrites)(4)
where Cmaxreads and Cmaxwrites denote the maximum number of disk reads/sec and disk writes/sec per spindle, respectively. Similar equations can be deduced for the other hardware resources.
It should be noted that the disk subsystem must be calibrated to determine Cmaxreads and Cmaxwrites. The disk calibration process performs a large number of uncached reads and writes to the disk to determine the maximum number of reads and writes the disk array can support. In hardware, Cmax reads and Cmaxwrites are most strongly functions of disk seek time and rotational latency.
In light of the layer-2 CSMA/CD protocol, θnetwork is often set to 36 percent on Ethernet networks.
The actual deployment scenario will consist of a mixed transaction environment as defined by the usage profile. The purpose of verification is to simulate this deployment scenario in order to (1) confirm that transactions do not negatively interfere with each other, and (2) verify that the resource costs estimated from the cost equations accurately reflect the actual costs measured.
The usage profile is translated into a verification script for each protocol. (There is nothing in principle to prevent creating a single verification script to invoke all protocols, but current tools do not presently support this.)
For a single protocol with multiple transactions, this script logic can be written in pseudo-code as:
   count  0
while ( count  < ti )
{
           if ( count mod ( ti / ni ,1 ) = 0 ) do transaction 1
          …
           if ( count mod ( ti / ni ,J ) = 0 ) do transaction J

           sleep sleepIncrement
           count  count + sleepIncrement
}
sleep rand smallNumber
Here sleepIncrement = gcd( ti / ni ,1 ,…, ti / ni ,J ) where gcd denotes the greatest common divisor and ti / ni , j is the length of time that must elapse between initiating each transaction j using protocol i. For each transaction j, this script initiates the correct number of transactions ni , j uniformly over the length of the service session time ti as defined by the usage profile. The statement sleep rand smallNumber is included to randomize the transaction arrival distribution (see footnote 5).
The load generation process is the same as in Load Generation in the “Performance Measurement” section, except that only one run is made for each usage profile simulated. During this run, the number of concurrent connections per service should approximately equal the number of concurrent users using that service as defined by the usage profile. Each load generator instance runs a single script (such as given in the Verification Script topic under “Model Verification”) representing the behavior of multiple users using one service. Multiple instances are run to generate the correct aggregate user load.
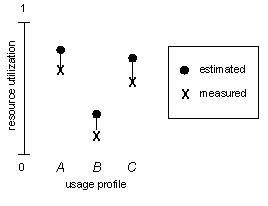
For each usage profile simulated, measurements of resource utilization are compared against the utilization estimates calculated using the cost equations from the “Cost Equations” section. The difference between the measured costs and estimated total costs should be small, according to the required confidence interval. This notion is depicted in Figure 7.
Figure 7: Error Between Cost Equation Estimates and Simulation Measurements for Three Different Usage Profiles A, B, and C
The usage profile from the example in the “Usage Profile” section indicates that the required throughput for Web page requests is 75 HTTP gets/sec and so on for the FTP transactions. The resource costs are then calculated using the equations developed in the “Cost Calculations” section.
In particular, suppose for the HTTP and FTP servers that the total CPU costs are calculated CtotalCPU = 2000 MHz. Further suppose that the deployment will occur with 400-MHz processor servers and that the requirement is to run these servers at less than 70 percent utilization. Then CmaxCPU = 400 MHz and θCPU = 70 percent, so that the total number of processors required is 2000 MHz / (0.7 * 400 MHz) = 7.1. In this case, two quad-processor servers will support the required load. Similar estimates are made for the other resources.
For verification, the system is then deployed with two quad-processor servers (as indicated by these calculations) and the appropriate load is generated using the verification scripts. This load should generate 9,000 concurrent HTTP connections and 1,000 concurrent FTP connections, as indicated by the usage profile example. Suppose an average of 77 HTTP gets/sec and average CPU utilization of 1900 MHz are measured. Then the throughput requirements are satisfied and the CPU utilization estimates are in error by 5 percent.
After TCA has been performed, it can be applied to capacity planning using the following procedure:
The requirements for performing TCA include:
This capacity model based on TCA has been successfully applied to estimate hardware platform deployment requirements for Microsoft® Commercial Internet System (MCIS) and Microsoft® Exchange products.
Information in this document, including URL and other Internet web site references, is subject to change without notice. The entire risk of the use or the results of the use of this resource kit remains with the user. This resource kit is not supported and is provided as is without warranty of any kind, either express or implied. The example companies, organizations, products, people and events depicted herein are fictitious. No association with any real company, organization, product, person or event is intended or should be inferred. Complying with all applicable copyright laws is the responsibility of the user. Without limiting the rights under copyright, no part of this document may be reproduced, stored in or introduced into a retrieval system, or transmitted in any form or by any means (electronic, mechanical, photocopying, recording, or otherwise), or for any purpose, without the express written permission of Microsoft Corporation.
Microsoft may have patents, patent applications, trademarks, copyrights, or other intellectual property rights covering subject matter in this document. Except as expressly provided in any written license agreement from Microsoft, the furnishing of this document does not give you any license to these patents, trademarks, copyrights, or other intellectual property.
© 1999-2000 Microsoft Corporation. All rights reserved.
Microsoft, Windows and Windows NT are either registered trademarks or trademarks of Microsoft Corporation in the U.S.A. and/or other countries/regions.
The names of actual companies and products mentioned herein may be the trademarks of their respective owners.