

| Specific Terms | Meaning |
| Import requests per second1 | Total number of requests processed during log file import divided by the total time required for log file import. |
| Import bytes per second | Total size of the log file imported divided by the total time required for log file import. |
1. This performance metric does not include requests that are explicitly excluded (such as JPEGs and GIFs) when configuring a Site in Usage Import.
This document discusses the performance and scalability characteristics of the Microsoft® Site Server version 3.0 Analysis feature. Analysis consists of four main tools: Usage Import, Report Writer, Custom Import, and Content Analyzer. This capacity and performance analysis focuses on the Usage Import tool. This tool’s primary function is to import log files that contain usage data about your site into the Analysis database.
The information in this document was generated by a series of tests run on two servers. Issues that were targeted in these tests were performance bottlenecks and scalability issues when importing log files to the Analysis feature.
Note Your performance numbers may vary from those provided here based on your hardware and software platform.
The potential performance bottlenecks associated with log file importing are enumerated here to assist you in capacity planning.
Processor and memory scalability are profiled in terms of import requests per second and bytes imported per second. This information should help you select the appropriate hardware configuration for your Analysis deployment.
The two servers used in these tests were configured as follows.
| Usage Analysis Server: | |
| CPU: | 1, 2, 4 x 200 MHz Pentium Pro |
| Memory: | 64, 128, 256, 512 MB of RAM |
| Disk: | 5 x 4.3 GB SCSI |
| File System: | NTFS |
| Network: | Intel EtherExpress Pro/100+ on 100 MB switched Ethernet |
| Software: | Microsoft® Windows NT® Server operating system version 4.0, SP3, Microsoft® Internet Information Services (IIS) version 4.0, Microsoft® Site Server version 3.0 |
| Microsoft SQL Server: | |
| CPU: | 4 x 200 MHz Pentium Pro |
| Memory: | 256 MB of RAM |
| Disk: | 2 x 4.3 GB SCSI |
| File System: | 2 GB FAT (C:), 6 GB NTFS (D:) |
| Network: | Intel EtherExpress Pro/100+ on 100 MB switched Ethernet |
| Software: | Windows NT Server 4.0, SP3, SQL Server 6.5 |
Analysis uses the log files generated by Web servers to analyze the usage and content of a site. The data in these log files falls into five categories:
Usage Import imports these log files into the Analysis database, where Report Writer can be used to analyze the log file content. For this capacity and performance analysis, a Microsoft® SQL Server™ database was used for the Analysis database.
First the log file is parsed. The data gets read into memory and put into a cache called the hits buffer. From the hits buffer, the inference engine takes the hits and matches the server, site, and user creating state data. In this phase, simple aggregations on the hit data are also performed. Once the user is identified, the inference engine will add requests to the user's visit. All the while the purging process periodically initiates and examines each user. The purge mechanism identifies users that have not performed any requests in more than 30 minutes (left the site), and flushes their data to the database. Each user contains the user information itself, plus their current visit and the requests that make up their visit.
All tests described in this document were run using pre-generated log files. Pre-generated log files are maximally dense; they do not contain entries that are filtered out of the input stream before import processing. Such entries that are filtered out before import processing include image file entries. A conservative estimate of the ratio of actual log file size to pre-generated log file size is 5 to 1. This ratio can be applied to important import performance metrics such as import requests per second and bytes imported per second. For example, if for a given hardware configuration and log file profile 300 requests per second is observed, then it is reasonable to assume that approximately 1500 requests per second would be observed with actual log files.
The Usage Import tests were run using a variety of pre-generated logs including those in the Table 1.
Table 1 Usage Import Test Suite
| Number of entries in pre-generated log | Projected number of entries in actual log | Log file size (MB) | Number of users | Number of visits per user | Number of requests per visit |
| 1,000 | 5,000 | 0.28 | 10 | 10 | 10 |
| 10,000 | 50,000 | 2.73 | 100 | 10 | 10 |
| 100,000 | 500,000 | 27 | 1,000 | 10 | 10 |
| 1 million | 5 million | 274 | 1,000 | 100 | 10 |
| 1 million | 5 million | 318 | 10,000 | 10 | 10 |
| 10 million | 50 million | 3196 | 100,000 | 10 | 10 |
Based on the data collected in this document, the following assertions can be made about scaling and performance for Analysis:
The tests in this document used two classes of pre-generated log files: those with a fixed number of users and those with a variable number of users.
A 273 MB log file consisting of one million entries with 1000 users, 100 visits per user, and ten requests per visit was used in this section.
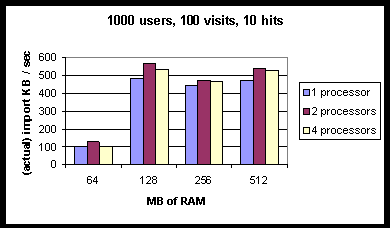
Charts 1, 2, and 3 show how total import time, import requests per second, and import bytes per second scaled in this test as a function of physical RAM. For systems with 64 MB of RAM, a substantial degradation in these performance metrics occurred with pages out per second increasing substantially to 135 pages out per second. The total number of private bytes consumed by all Analysis executables is approximately 44 MB, not leaving enough physical RAM space for Microsoft® Windows NT® and other required services.
Charts 1, 2, and 3 also show how total import time, import requests per second, and import bytes per second scaled as a function of the number of processors.
In systems configured with at least 128 MB of RAM, memory is not a bottleneck and the performance metrics change only marginally as the number of processors is varied. Two-processor systems improve import request rates and import byte rates between six percent and 17 percent over the rates of one-processor systems.
Chart 1 Import time scaling
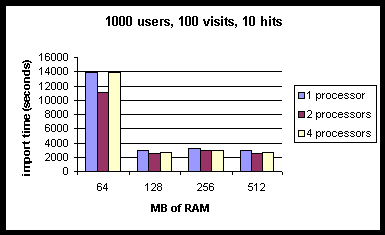
Chart 2 Import requests per second scaling (actual log file)
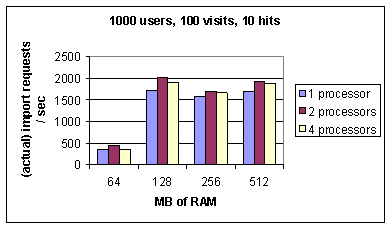
Chart 3 (Actual log file) import bytes per second scaling
It is of interest to measure how the performance changes as the number of users, and the number of open visits, increases. Because the performance improvement of importing with two-processors is only marginal and because insufficient memory was shown to bottleneck performance substantially, a system configuration with one-processor and 512 MB of RAM was chosen to collect measurements.
Figure 1 shows that the import time is a linear function of the number of open visits.
Figure 1
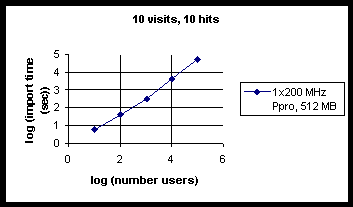
Table 2 shows the import time as a function of the projected number of entries in an actual log file which consists of a variable number of users with ten visits per user and ten requests per visit.
Table 2
| Number of users | Number of entries in pre-generated log | Number of entries in actual log | Import time |
| 10 | 1,000 | 5,000 | 6 sec |
| 100 | 10,000 | 50,000 | 44 sec |
| 1000 | 100,000 | 500,000 | 5 min. 19 sec. |
| 10000 | 1 million | 5 million | 1 hr. 37 sec. |
| 100000 | 10 million | 50 million | 15 hr. 9 min. 32 sec. |
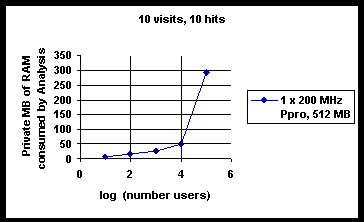
Figures 2 and 3 show that during the tests import requests per second and import bytes per second began to decrease as a function of the number of users once the number of users increased to about 10,000. The total private bytes consumed by all Analysis executables is shown in Figure 4 and did not exceed 294 MB for up to 100,000 users, therefore leaving sufficient RAM space for operation of Windows NT and other required services. This suggests that insufficient memory was not a bottleneck contributing to performance degradation in this case.
Figure 2
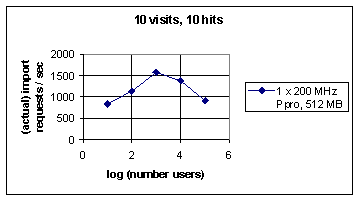
Figure 3
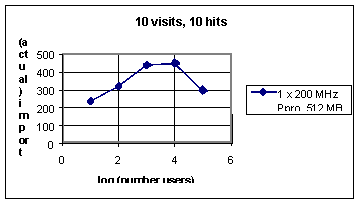
Figure 4
Performance degradation may be explained by heavy consumption of Analysis server processor and SQL Server disk resources during the first 26 percent of total import time of the log file with 10,000 users. During the first six percent of the total import time, processor utilization is approximately 100 percent. This initial period of time extends beyond the time required to create the first 10,000 open visits. The next 20 percent of the total import time is spent handling substantial SQL Server disk activity. In particular, disk activity increases and averages approximately 48 percent overall with sustained periods of 100 percent disk utilization. After this first 26 percent of total import time is complete, all hardware resource consumption remains within reasonable bounds.
The results of the tests discussed in this document suggest that for best performance, you follow these recommendations:
Analysis Server Processor Scaling
| MB of RAM | Number of Processors | Percentage of total
CPU utilization |
Context switching per second | Import requests per second | Import bytes per second | (Actual) import requests per second | (Actual) import bytes per second |
| 64 | 1 | 15 | 811 | 72 | 20771 | 360 | 103855 |
| 64 | 2 | 11 | 1463 | 90 | 25904 | 450 | 129520 |
| 64 | 4 | 4 | 1028 | 72 | 20658 | 360 | 103290 |
| 128 | 1 | 54 | 494 | 345 | 99146 | 1725 | 495730 |
| 128 | 2 | 35 | 2885 | 405 | 116380 | 2025 | 581900 |
| 128 | 4 | 17 | 3741 | 382 | 109753 | 1910 | 548765 |
| 256 | 1 | 51 | 321 | 316 | 90636 | 1580 | 453180 |
| 256 | 2 | 25 | 2245 | 336 | 96709 | 1680 | 483545 |
| 256 | 4 | 16 | 4214 | 332 | 95360 | 1660 | 476800 |
| 512 | 1 | 55 | 559 | 338 | 97101 | 1690 | 485505 |
| 512 | 2 | 33 | 3743 | 386 | 110897 | 1930 | 554485 |
| 512 | 4 | 16 | 2741 | 378 | 108551 | 1890 | 542755 |
Analysis Server Memory Scaling
| MB of RAM | Number of Processors | Total Analysis Private Megabytes | Total system available bytes | Pages in per second | Pages out per second |
| 64 | 1 | Approx 44 | 2221439 | 110 | 135 |
| 64 | 2 | 3083006 | 140 | 199 | |
| 64 | 4 | 2683335 | 110 | 142 | |
| 128 | 1 | 10634085 | 38 | 5.8 | |
| 128 | 2 | 12616466 | 28 | 1.3 | |
| 128 | 4 | 11877117 | 38 | 2.1 | |
| 256 | 1 | 99938472 | 22 | 0.7 | |
| 256 | 2 | 130668896 | 20 | 1 | |
| 256 | 4 | 122526624 | 44 | 2.4 | |
| 512 | 1 | 358771712 | 42 | 1.7 | |
| 512 | 2 | 365349088 | 38 | 1.5 | |
| 512 | 4 | 369011232 | 25 | 1 |
SQL Server Disk Scaling
| Analysis Server MB of RAM | Analysis Server number of processors | Percentage of SQL Server disk Utilization | SQL disk reads/sec | SQL disk writes/sec |
| 64 | 1 | 0.9 | 0.5 | 4.1 |
| 64 | 2 | 1 | 0.6 | 5 |
| 64 | 4 | 0.7 | 0.3 | 3.8 |
| 128 | 1 | 4.9 | 4.1 | 18.2 |
| 128 | 2 | 5 | 2.9 | 21.7 |
| 128 | 4 | 6.7 | 6.1 | 21.5 |
| 256 | 1 | 5.6 | 5.4 | 17.4 |
| 256 | 2 | 3.7 | 2 | 17.4 |
| 256 | 4 | 3.9 | 2.2 | 17.6 |
| 512 | 1 | 4.1 | 2.5 | 18.8 |
| 512 | 2 | 5.1 | 3.2 | 21.3 |
| 512 | 4 | 6 | 5.3 | 20.9 |
All counters noted can be found in the Microsoft ® Windows NT® Performance Monitor and can be used to capture potential performance bottlenecks due to excessive hardware resource utilization.
The counters in the Usage Analysis server memory, process, and system objects and the SQL Server physical disk object can be used to monitor capacity.
Available bytes
Committed bytes
Pages in per second
Pages out per second
Private bytes UAS, Uimport
Working set UAS, Uimport
Percentage of total processor
Percentage of disk time
Disk reads per second
Disk writes per second
Average disk queue length
Information in this document, including URL and other Internet web site references, is subject to change without notice. The entire risk of the use or the results of the use of this resource kit remains with the user. This resource kit is not supported and is provided as is without warranty of any kind, either express or implied. The example companies, organizations, products, people and events depicted herein are fictitious. No association with any real company, organization, product, person or event is intended or should be inferred. Complying with all applicable copyright laws is the responsibility of the user. Without limiting the rights under copyright, no part of this document may be reproduced, stored in or introduced into a retrieval system, or transmitted in any form or by any means (electronic, mechanical, photocopying, recording, or otherwise), or for any purpose, without the express written permission of Microsoft Corporation.
Microsoft may have patents, patent applications, trademarks, copyrights, or other intellectual property rights covering subject matter in this document. Except as expressly provided in any written license agreement from Microsoft, the furnishing of this document does not give you any license to these patents, trademarks, copyrights, or other intellectual property.
©1998-2000 Microsoft Corporation. All rights reserved.
Microsoft, Windows and Windows NT are either registered trademarks or trademarks of Microsoft Corporation in the U.S.A. and/or other countries/regions.
The names of actual companies and products mentioned herein may be the trademarks of their respective owners.