Microsoft Visual InterDev 6.0 Debugging
Microsoft Corporation
October 1998
Revised: November 1999
Click to open or copy the sample files associated with this technical article.
Summary: Provides answers and solutions to common questions and debugging problems. (42 printed pages) Covers:
- Setting up client-only, local server, and remote debugging
- Basic debugging operations
- ASP, script, and local mode debugging
- A list of common problems
Powerful, cross-process debugging is one of the most compelling features of Microsoft® Visual InterDev™ version 6.0. Because several software components are involved in Visual InterDev 6.0 debugging (including system services like Internet Information Server), special consideration must be given to the setup and configuration of your Visual InterDev debugging environment. This document attempts to answer the most common questions and provide solutions to several common debugging problems.
Contents
Overview
Debugging in Visual InterDev 6.0
Terminology
Debugging Setup
Setting Up Client-Only Debugging
Setting Up Local Server Debugging
Setting Up Remote Debugging
Verifying Debugging Setup
Debugging Operations
Basic Debugging Operations
Enabling ASP Debugging from a Visual InterDev Web Project
Manually Enabling ASP Debugging
Debugging Client Script
Debugging Projects in Local Mode
Debugging Server Script
Remote Debugging
Common Problems
Overview
Debugging in Visual InterDev 6.0
The distributed nature of Web applications requires that developers be able to seamlessly debug application logic across both the client and the server, and attach to and debug processes running on remote servers. With Visual InterDev 6.0, developers can now set breakpoints on both client- and server-side script, step through code, add "watch" variables, investigate the call stack, and debug remote Web servers.
Developers can choose from one of three debugging configurations in Visual InterDev. Each configuration enables a subset of Visual InterDev debugging capabilities. Of the several potential pitfalls to successfully debugging Visual InterDev applications, most are related to setup failures and incorrect security permissions. This article describes how to set up and use each configuration.
Client-only debugging
Visual InterDev 6.0 permits developers to debug client scripts running in HTML or Active Server Pages (ASP) pages against their local workstation using a local copy of Personal Web Server in Microsoft Windows® 95 or Windows® 98. This configuration does not support debugging of server script in ASP pages.
Local server debugging
Typically, individual developers use Local mode in Visual InterDev 6.0 to build, test, and debug portions of the application in isolation from the rest of the team. In this case, they run a local copy of Microsoft Internet Information Server (IIS) on their Windows NT® development machine to debug their Web pages before checking them into the master Web project. This is the recommended debugging configuration in Visual InterDev 6.0.
Remote debugging
Developers can also attach to and debug server scripts running in ASP pages on a remote IIS. This is a powerful feature that permits a developer to issue debugging commands across the network; however, it is limited in that only one user can use Remote Debugging on a server at a time.
Terminology
There are several terms and abbreviations that will be used in this article. Some or all of them may already be familiar to you. They are listed here for completeness:
- MTS—Microsoft Transaction Server.
- IIS—Microsoft Internet Information Server 4.0.
- Out-of-proc—Out-of-process Webs. These will be executed within separate MTS (Mtx.exe) processes.
- In-proc—In-process Webs. These will be executed within the IIS (Inetinfo.exe) process.
- ASP—Active Server Pages.
- SSL—Secure Sockets Layer.
- JIT—Just-In-Time debugging.
Debugging Setup
Setting Up Client-Only Debugging
Client-Only Debugging permits developers to debug client scripts running in HTML pages against their local workstation using a local copy of Personal Web Server in Windows 95 or Windows 98.
It does not support debugging of client or server script in ASP pages.
Note The capabilities of Client-Only Debugging are a subset of those available in the recommended configuration (Local Server Debugging).
Basic requirements
Following are the basic requirements for Client-Only Debugging in Visual InterDev 6.0:
- Microsoft Windows 95 or Microsoft Windows 98
- Visual InterDev 6.0
- Personal Web Server
- Front Page Server Extensions
Installing the software
Install the software using these steps in the order listed:
Install Visual InterDev development environment
- Insert installation compact disc 1 into your computer.
- Setup.exe automatically runs the Installation Wizard. The wizard steps you through the installation process.
Note Depending on your selections and your current configuration, the wizard will prompt you to install different required components and to reboot Windows one or more times during the installation process. After each reboot, the wizard automatically returns to the proper step.
- Follow the steps of the Installation Wizard until you are prompted to select either Install Visual InterDev 6.0 or Server Applications.
- Select Install Visual InterDev 6.0 and click Install.
- When prompted, select either a Typical or Custom installation.
- After the Visual InterDev development environment has been installed on your computer, you are prompted to install MSDN™, the Microsoft Developer Network. Note that you need to install MSDN in order for F1 Help to work and to have access to the Visual InterDev documentation.
Install Personal Web Server
Note The following components are required for the PageNavbar design-time control (DTC), Remote Debugging, and for previewing Active Server Pages on your local machine. You may choose not to select these components if you do not want to take advantage of these features.
- Select NT Option Pack Common Files and click Install. This launches the Microsoft Personal Web Server Setup.
- When prompted to select Minimum, Typical, or Custom, select Custom.
- When the list of components appears, select the following:
- Common Program Files
- Microsoft Data Access Components (MDAC) 1.5
- Personal Web Server (PWS)
- Transaction Server
- Clear the remaining components. As you clear the other components, the wizard might display a message that warns you of various dependencies. You can click Yes to ignore the dependencies because you are using this computer as a client for Visual InterDev, not as a server.
- Continue with the remaining steps of the Personal Web Server Setup.
- When you return to the Server Setup screen, select FrontPage 98 Server Extensions and click Install.
- Continue with the remaining steps of the wizard.
Enable client script debugging in ASP pages
When Personal Web Server (PWS) processes an ASP page, the resulting page sent to the browser can be considerably different than what you see when you edit the ASP page in the editor. Server script can generate new client content dynamically or, conversely, a large quantity of server script can result in only a few lines of client HTML output. This situation introduces problems when you set breakpoints in client script inside an ASP page because the line on which you set the breakpoint can move dramatically within the file by the time the page reaches the browser.
The following steps describe how to enable client-side debugging in ASP pages. Doing so specifies that PWS tracks the location of client script breakpoints in an ASP page, and passes the location of those breakpoints to Microsoft Internet Explorer so that Internet Explorer can stop at the correct locations.
Note If you intend to work exclusively with client script in .htm files, you do not need to enable client-side ASP debugging or perform the following procedure.
- In the Visual InterDev Tools menu, select Options.
- Click the Debugging category.
- Under Script, make sure Insert breakpoints in Active Server Pages for breakpoints in client script is selected.
- Click OK.
- In the Visual InterDev Project Explorer, right-click the file you want to debug and select Set as Start Page.
- Start the debugger.
Setting Up Local Server Debugging
The following apply to Local Server Debugging:
- Permits individual developers to build, test, and debug portions of a Web application in isolation from the rest of the team
- Can be used to debug client script, server script, or Microsoft Visual J++ components
- Is the recommended debugging configuration in Visual InterDev 6.0
Basic requirements
Following are the basic requirements for Local Server Debugging in Visual InterDev 6.0:
- Microsoft Windows NT 4.0 Server or Windows NT 4.0 Workstation
- Internet Information Server 4.0 or higher or Personal Web Server for Windows NT 4.0 Workstation
- Visual InterDev 6.0
- Windows NT 4.0 Service Pack 3 or later
- IIS Hotfix shipped with Visual InterDev or Windows NT 4.0 Service Pack 4 or later
- FrontPage Server Extensions
- Windows NT Administrator privileges
Installing the software
Install the software following these steps in the order listed:
Install Visual InterDev development environment
- Insert installation compact disc 1 into your computer.
- Setup.exe automatically runs the Installation Wizard. The wizard steps you through the installation process.
Note Depending on your selections and your current configuration, the wizard will prompt you to install different required components and to reboot Windows one or more times during the installation process. After each reboot, the wizard automatically returns to the proper step.
- Follow the steps of the Installation Wizard until you are prompted to select either Install Visual InterDev 6.0 or Server Applications.
- Select Install Visual InterDev 6.0 and click Install.
- When prompted, select either a Typical or Custom installation.
- After the Visual InterDev development environment has been installed on your computer, you are prompted to install MSDN. Note that you need to install MSDN in order for F1 Help to work and to have access to the Visual InterDev documentation.
Install server components
- Next, select Launch BackOffice Installation Wizard and click Install.
- The BackOffice Installation Wizard will prompt you to select a Custom or Visual InterDev Developer option. Select Custom and click Next.
- Verify the disk space requirements and click Next.
- Select Remote Machine Debugging, Visual InterDev Server, Front Page Server Extensions, and MS Data Access Components from the top level of the components list.
Note Remote Machine Debugging is another component of the BackOffice Server Wizard. It sets up the latest versions of the debugging components as well as some registry keys that allow Visual InterDev to connect to the Transaction Server for debugging. The stand-alone setup for this is located in the Scrpt_ss directory on CD1 of Visual InterDev Professional Edition, or CD2 of Visual Studio Professional or Enterprise Edition.
Note Visual InterDev Server is another component of the BackOffice Server Wizard. It is required for debugging. The stand-alone setup for this is located in the Vid_ss directory on CD1 of Visual InterDev Professional Edition, or CD2 of Visual Studio Professional or Enterprise Edition.
Note If the Windows NT Option Pack is reinstalled, the Remote Machine Debugging and Visual InterDev Server components must also be reinstalled.
- Expand the Windows NT Option Pack node and select the following:
- Internet Information Server
- Microsoft Management Console (MMC)
- NT Option Pack Common Files
- Transaction Server
Note The default IIS installation will set up the needed components, but there are some that you may turn off without adverse effect. The FTP server, the NNTP server, and the SMTP server are all unnecessary for debugging. The NNTP and SMTP servers are only installed on Windows NT Server, whereas FTP server is an option for Windows NT Server and Windows NT Workstation.
- Click Next and continue with the remaining steps of the BackOffice Installation Wizard.
Install ASP Hotfix or Windows NT 4.0 Service Pack 4 or Later
Windows NT 4.0 Service Packs 4 and later contain a large number of bug fixes for IIS, but they were not available until after Visual Studio 6.0 shipped. A small number of these bugs are debugging-specific, and can seriously hamper using the debugger productively. To remedy the situation until the Windows NT Service Packs were released, IIS released a Hotfix that contains the fixes needed for debugging. The Hotfix changes only one file, Asp.dll, and will not change its version number, so all other setups, including the Windows NT 4.0 Service Packs, will correctly update it later.
Note You may need to stop the Web services before installing the Hotfix or Service Packs in order for these program to correctly update the Asp.dll file. You can do this by stopping the "IIS Admin Service" from within the Services applet in Control Panel.
- Run \Iis\WinNT\Asp2fix1.exe from the installation disc (see upcoming note).
- For Visual InterDev Professional Edition, it's located on CD1.
- For Visual Studio Professional Edition, it's located on CD2.
- For Visual Studio Enterprise Edition, it's located on CD3.
- Reboot when prompted.
The executable file is also included later in this document for your convenience. Note that this is the Windows NT version and will not work properly on machines running Windows 9x. When Windows NT 4.0 Service Pack 4 is available, it is recommended that you upgrade to it and stop relying on this Hotfix, which is meant as a temporary workaround.
Giving users permission to debug
To give users the ability to debug, log on to the machine as an administrator and follow these steps:
- From the Start button, select Programs, and click Administrative Tools (Common).
- Run User Manager for Domains.
- Add the user's Windows NT account to the Administrators group.
- From the Start button, click Run on the server computer.
- Type Dcomcnfg.exe and click OK.
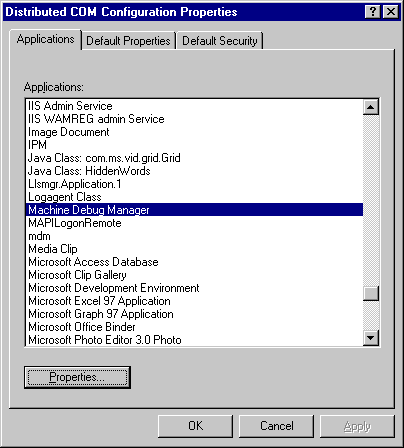
- On the Applications tab, find Catalog Class (see Figure 1) and click the Properties button.

Figure 1. Applications tab
Note The Catalog Class and Machine Debug Manager items are installed with the BackOffice Installation Wizard and are part of the server components for Visual InterDev 6.0. If the Catalog Class and Machine Debug Manager applications do not show up in the Applications tab, see the section "Potential Errors or Problems."
- This will open a dialog box titled Catalog Class Properties with four tabs. Click the Security tab.
- Select Use custom access permissions and click Edit (see Figure 2).

Figure 2. Security tab
- This launches the standard Windows NT Add/Remove users dialog box (see Figure 3). You can now add or remove any Windows NT user accounts or groups that you wish to have or deny permission. (The simplest way is to add the Administrators group because in step 1 you added all of the users that you want to allow Local Debugging into this group.)
Note Due to a Windows NT bug, the Interactive User account will not work for granting debugging access. Users logged on to the server will not be able to debug even though this would seem to allow it. This should be fixed in Windows NT 4.0 Service Pack 4.

Figure 3. Windows NT Add/Remove users dialog box
- Click OK when you are finished making changes.
- Repeat steps 5–8 for the Use custom launch permissions option.
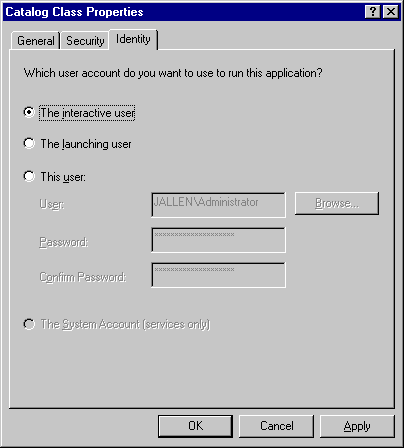
Note In the Identity tab (see Figure 4), if The interactive user option is selected, make sure a member of the Administrators group is currently logged on to the machine while attempting to debug ASP pages. If the This user option is selected, make sure the specified user is a member of the Administrators group. Also, do not use The launching user option when configuring for the Machine Debug Manager application.

Figure 4. Identity tab
- Click OK to close the Catalog Class Properties dialog box, select the Machine Debugger Manager from the Applications tab list box, and click the Properties button (see Figure 5).

Figure 5. Select the “Machine Debug Manager”
- Repeat steps 4–8 for the Machine Debug Manager.
Note Any user wanting to debug on this machine must have access to all four sets of DCOM permissions lists (access permission in Catalog Class, launch permission in Catalog Class, launch permission in Machine Debug Manager, launch permission in Machine Debug Manager) to ensure success.
- Click OK to close the Dcomcnfg.exe dialog box.
- Reboot the machine. When the machine restarts, the new users will have permission to debug.
Note You may notice that the Interactive User account is added to all of the classes that were mentioned earlier. It would seem that having this account added and logged on to the server would be all you need to enable a machine for debugging. This will not work, however, because of a bug in Windows NT, which is fixed in Windows NT 4.0 Service Pack 4. After Service Pack 4 is installed, users may log on to the remote server and expect Remote Debugging to work correctly, without following the preceding steps.
Automatically enable server script debugging in ASP pages
You can manually enable server-side debugging for your ASP application as described under "Manually Enabling ASP Debugging" later in this article. Alternatively, Visual InterDev can automatically enable debugging on the server as needed.
Note If you intend to work exclusively with client script in .htm files, you do not need to enable server debugging or perform the following procedure.
Note When automatically enabling server-side debugging, Visual InterDev will enable client-side debugging as well.
- In the Visual InterDev Project Explorer, right-click the project and click Properties to display the Property Pages dialog box.
- Click the Launch tab.
- Under Server script, make sure Automatically enable ASP server-side debugging on launch is selected.
- Click OK to close the Properties dialog box.
- In the Visual InterDev Project Explorer, right-click the file you want to debug and select Set as Start Page.
- From the Debug menu, select Launch, or click the Play button on the Project toolbar.
Note To debug script in ASP pages, you must be running version 4.0 or later of Microsoft Internet Information Server (IIS).
When these steps are followed, each time you start a debugging session Visual InterDev automatically configures the server for debugging. This includes the following:
- Setting the IIS application to run in its own memory space. (In COM terms, it runs "out of process.")
- Enabling the IIS application's debugging options.
- Setting up an MTS package to allow you to attach the debugger to the Web application. The package's identify is set when you first start the debugging session by asking you to provide your name and password.
When you quit your debugging session, Visual InterDev restores the server debugging settings and out-of-process setting to their previous values.
Setting Up Remote Debugging
Remote Debugging permits developers to attach to and debug server scripts running in ASP pages on a remote IIS.
In addition, Remote Debugging is limited in that only one user can use Remote Debugging on a server at a time.
Basic requirements: client
Following are the basic requirements for the client machine for Remote Debugging:
- Microsoft Windows NT 4.0 Workstation or higher or Microsoft Windows NT 4.0 Server or higher
- Visual InterDev 6.0
- Internet Information Server 4.0 or higher or Personal Web Server for Windows NT 4.0 Workstation
Basic requirements: server
Following are the basic requirements for the remote server machine in Remote Debugging:
- Microsoft Windows NT 4.0 Server or Windows NT 4.0 Workstation
- Internet Information Server 4.0 or higher or Personal Web Server for Windows NT 4.0 Workstation
- Windows NT 4.0 Service Pack 3 or later
- IIS Hotfix shipped with Visual InterDev or Windows NT 4.0 Service Pack 4 or later
- FrontPage Server Extensions
- Windows NT Administrator privileges
Client setup
To set up the client (developer's) machine follow these steps:
Install Visual InterDev development environment
- Insert installation compact disc 1 into your computer.
- Setup.exe automatically runs the Installation Wizard. The wizard steps you through the installation process.
Note Depending on your selections and your current configuration, the wizard will prompt you to install different required components and to reboot Windows one or more times during the installation process. After each reboot, the wizard automatically returns to the proper step.
- Follow the steps of the Installation Wizard until you are prompted to select either Install Visual InterDev 6.0 or Server Applications.
- Select Install Visual InterDev 6.0 and click Install.
- When prompted, select either a Typical or Custom installation.
- After the Visual InterDev development environment has been installed on your computer, you are prompted to install MSDN. Note that you need to install MSDN in order for F1 Help to work and to have access to the Visual InterDev documentation.
Install server components on client
Three server components are required for the client to be able to automatically set up debugging on the remote server: Common Files, Management Console, and Internet Service Manager.
- Select Launch BackOffice Installation Wizard and click Install.
- The BackOffice Installation Wizard will prompt you to select a Custom or Visual InterDev Developer option. Select Custom and click Next.
- Verify the disk space requirements and click Next.
- Expand the Windows NT Option Pack node and select:
- Internet Service Manager
- Microsoft Management Console
- NT Option Pack Common Files
Note If you already have IIS installed, you need to make sure these three options are installed by going to Add/Remove in the Windows NT 4.0 Option Pack Setup. A side benefit to installing these components is that you can use the Internet Service Manager to administer the remote server.
- Click Next and continue with the remaining steps of the BackOffice Installation Wizard.
Server setup
Install server components
To set up the server for Remote Debugging follow these steps:
- Select Launch BackOffice Installation Wizard and click Install.
- The BackOffice Installation Wizard will prompt you to select a Custom or Visual InterDev Developer option. Select Custom and click Next.
- Verify the disk space requirements and click Next.
- Select Remote Machine Debugging, Visual InterDev Server, Front Page Server Extensions, and MS Data Access Components from the top level of the components list.
Note Remote Machine Debugging is another component of the BackOffice Server Wizard. It sets up the latest versions of the debugging components as well as some registry keys that allow Visual InterDev to connect to the Transaction Server for debugging. The stand-alone setup for this is located in the Scrpt_ss directory on CD1 of Visual InterDev Professional Edition, or CD2 of Visual Studio Professional or Enterprise Edition.
Note Visual InterDev Server is another component of the BackOffice Server Wizard. It is required for debugging. The stand-alone setup for this is located in the Vid_ss directory on CD1 of Visual InterDev Professional Edition, or CD2 of Visual Studio Professional or Enterprise Edition.
Note If the Windows NT 4.0 Option Pack is reinstalled, the Remote Machine Debugging and Visual InterDev Server components must also be reinstalled.
- Expand the Windows NT 4.0 Option Pack node and select the following:
- Internet Information Server
- Microsoft Management Console
- NT Option Pack Common Files
- Transaction Server
Note The default IIS installation will set up the needed components, but there are some that you may turn off without adverse effect. The FTP server, the NNTP server, and the SMTP server are all unnecessary for debugging. The NNTP and SMTP servers are only installed on Windows NT 4.0 Server, whereas FTP server is an option for Windows NT 4.0 Server and Windows NT 4.0 Workstation.
- Click Next and continue with the remaining steps of the BackOffice Installation Wizard.
Install ASP Hotfix or Windows NT 4.0 Service Pack 4 or later
Windows NT 4.0 Service Packs 4 and later contain a large number of bug fixes for IIS, but they were not available until after Visual Studio 6.0 shipped. A small number of these bugs are debugging-specific and can seriously hamper using the debugger productively. To remedy the situation until the Windows NT Service Packs were released, IIS released a Hotfix that contains the fixes needed for debugging. The Hotfix changes only one file, Asp.dll, and will not change its version number, so all other setups, including the Windows NT 4.0 Service Packs, will correctly update it later.
Note You may need to stop the Web services before installing the Hotfix or Service Packs in order for these program to correctly update the Asp.dll file. You can do this by stopping the "IIS Admin Service" from within the Services applet in Control Panel.
- Run \IIS\WinNT\ASP2FIX1.exe from the installation disc (see upcoming note).
- For Visual InterDev Professional Edition, it's located on CD1.
- For Visual Studio Professional Edition, it's located on CD2.
- For Visual Studio Enterprise Edition, it's located on CD3.
- Reboot when prompted.
Giving users permission to debug
To give users the ability to debug, follow these steps with the machine on which IIS is located. You must be currently logged on to the machine as an administrator to do so.
Note By default, the user that is logged on when the Remote Machine Debugging Server Setup runs will be given permission to debug the server on that machine. Anyone other than this user must be added using the following steps:
- From the Start button, select Programs and click Administrative Tools (Common).
- Run User Manager for Domains.
- Add the user's Windows NT account to the Administrators group.
- From the Start button, click Run on the server computer.
- Type Dcomcnfg.exe and click OK.
- On the Applications tab, find Catalog Class (see Figure 1) and click the Properties button.
Note The Catalog Class and Machine Debug Manager items are installed with the BackOffice Installation Wizard and are part of the server components for Visual InterDev 6.0. If the Catalog Class and Machine Debug Manager applications do not show up in the Applications tab, see the section "Potential Errors or Problems."
- This will open a dialog box titled Catalog Class Properties with four tabs. Click the Security tab.
- Select Use custom access permissions and click Edit (see Figure 2).
- This launches the standard Windows NT Add/Remove users dialog box (see Figure 3). You can now add or remove any Windows NT user accounts or groups that you wish to have or deny permission. (The simplest way is to add the Administrators group because in step 1 you added all of the users that you want to Remote Debug into this group.)
Note Due to a Windows NT bug, the Interactive User account will not work for granting debugging access. Users logged on to the server will not be able to debug even though this would seem to allow it. This should be fixed in Windows NT 4.0 Service Pack 4.
- 6Click OK when you are finished making changes.
- Repeat steps 5–8 for the Use custom launch permissions option.
Note In the Identity tab (see Figure 4), if The interactive user option is selected, make sure a member of the Administrators group is currently logged on to the machine when attempting to debug ASP pages. If the This user option is selected, make sure the specified user is a member of the Administrators group. Also, do not use The launching user option when configuring for the Machine Debug Manager application.
- Click OK to close the Catalog Class Properties dialog box, select the Machine Debugger Manager from the Applications tab list box, and click the Properties button (see Figure 5).
- Repeat steps 4–8 for the Machine Debug Manager.
Note Any user wanting to debug on this machine must have access to all four of these groups to ensure success.
- Click OK to close the Dcomcnfg.exe dialog box.
- Reboot the machine. When the machine restarts, the new users will have permission to debug.
Note You may notice that the Interactive User account is added to all of the classes that were just mentioned. It would seem that having this account added and logged on to the remote server would be all you need to enable a machine for Remote Debugging. This will not work, however, because of a bug in Windows NT, which is fixed in Windows NT 4.0 Service Pack 4. After Service Pack 4 is installed, users may log on to the remote server and expect Remote Debugging to work correctly, without following the preceding steps.
Automatically enable server script debugging in ASP pages
You can manually enable server-side debugging for your ASP application as described under "Manually Enabling ASP Debugging" later in this article. Alternatively, Visual InterDev can automatically enable debugging on the server as needed.
Note If you intend to work exclusively with client script in .htm files, you do not need to enable server debugging or perform the following procedure.
Note When automatically enabling server-side debugging, Visual InterDev will also enable client-side debugging as well.
- In the Visual InterDev Project Explorer, right-click the project and click Properties to display the Property Pages dialog box.
- Click the Launch tab.
- Under Server script, make sure Automatically enable ASP server-side debugging on launch is selected.
- Click OK to close the Properties dialog box.
- In the Visual InterDev Project Explorer, right-click the file you want to debug and select Set as Start Page.
- From the Debug menu, select Launch, or click the Play button on the Project toolbar.
Note To debug script in ASP pages, you must be running version 4.0 or later of Microsoft Internet Information Server (IIS).
When these steps are followed, each time you start a debugging session, Visual InterDev automatically configures the remote server for debugging. This includes the following:
- Setting the IIS application to run in its own memory space. (In COM terms, it runs "out of process.")
- Enabling the IIS application's debugging options.
- Setting up a Microsoft Transaction Server package to allow you to attach the debugger to the Web application. The package's identify is set when you first start the debugging session by asking you to provide your name and password.
When you quit your debugging session, Visual InterDev restores the server debugging settings and out-of-process setting to their previous values.
Verifying Debugging Setup
John Schenken has written a useful command-line tool that reports all of the information on debugging setup. (Viddbg.exe is included in the downloadable .zip file at the top of this article.) This can help find problems with the debugging setup and can help Microsoft Product Support Services determine solutions more quickly. To use it, copy it to a directory on your path and include one of the following options on the end:
/Server—Reports on the accounts that have DCOM permissions set up (and thus the ability to remotely debug the machine), the Script and Java options for the machine, and the Asp.dll version and checks that the registry files used by Visual InterDev for auto-enabling server debugging exist on the machine.
/Client—Reports on the Script and Java options for the machine, and the location of the management console and Internet Service Manager files needed to enable debugging on a remote machine.
/Ver—Lists all of the debugging related files and the version numbers of each.
Debugging Operations
Basic Debugging Operations
You can start debugging in the following ways:
- Run the Web document you are currently working with from Source View.
- Attach the debugger to a document that is already running in a browser or on a server using the Process dialog box.
- Launch the debugger in response to a script error, which is called Just-In-Time (JIT) debugging.
You can control execution in the following ways:
- Stop script execution by issuing a break command.
- Set a breakpoint in the script where the debugger will stop automatically.
- Jump to the end (step out) of the current procedure and proceed to the next breakpoint.
- Change values and execute commands in the Immediate window.
- Skip over (step over) or walk through (step into) procedures called by the current procedure. If multiple procedures or threads are active, you can move to another one and proceed from there.
- Move to any currently active procedure in the Call Stack window.
You can inspect the application state in the following ways:
- Examine the values of variables or properties in the Locals window.
- Set up Watch Expressions in the Watch window to display the values of specific expressions.
- To set and change values, use the Immediate window. You can evaluate any expression in the window and enter script commands and see their effect. You can also view and change values in the Watch window.
Enabling ASP Debugging from a Visual InterDev Web Project
There are several steps required to manually enable ASP debugging. Visual InterDev, however, can enable the needed options and start the debugging session automatically. To do this, follow these steps:
- Open a Visual InterDev Web project and add an ASP page to it.
- In the Project Explorer, select the ASP page. Right-click the page to bring up the Shortcut menu, and select the Set as Start Page option. The browser will request this page when the debugging session is started. You can set breakpoints in the file, or have Stop or debugger statements to cause the ASP code to break.
- Next, in the Project Explorer, right-click the Web root and select the Properties command from the Shortcut menu.
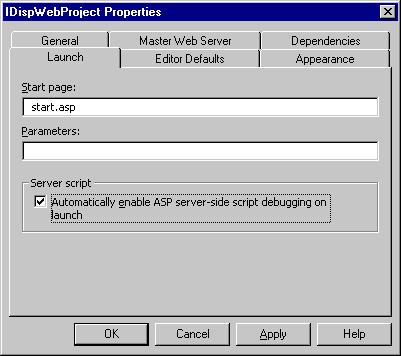
- In the IDispWebProject Properties dialog box that appears, click the Launch tab and select the check box labeled Automatically enable ASP server-side script debugging on launch option (see Figure 6). Notice that you can also add querystring parameters to the start page via the Parameters text box. Enter the querystring as it appears in the browser to append it to the start page when the debugging session is started.

Figure 6. IDispWebProject Properties dialog box
- Click OK to close the dialog box.
- From the Debug menu, select Launch, or click the Play button on the Project toolbar.
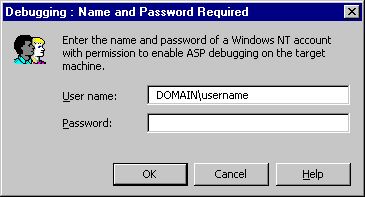
- When prompted (see Figure 7), log on with an account that has permissions to debug on the machine. The account information will default to whomever is currently logged on, but this information can be changed.
- Click OK to this prompt, and the debugger session will start.

Figure 7. Debugging login dialog box
From this point, Visual InterDev will do the following:
- Enable ASP debugging on the Web and attach to the ASP process.
- Launch and attach to Internet Explorer.
- Request the start page in Internet Explorer.
When these options are set for your project, each time you start a debugging session Visual InterDev does the following things:
- Sets the IIS application to run in its own memory space. (In COM terms, it runs "out of process.")
- Enables the IIS application's debugging options.
- Sets up a Microsoft Transaction Server (MTS) package to allow you to attach the debugger to the Web application. The package's identify is set when you first start the debugging session by asking you to provide your name and password.
- Launches and attaches to Internet Explorer.
- Requests the start page in Internet Explorer.
When you quit your debugging session, Visual InterDev will detach from all processes, restore the server debugging settings and out-of-process setting to their previous values, and close Internet Explorer.
Manually Enabling ASP Debugging
As was just shown, Visual InterDev can enable and disable debugging on a Web project as necessary. This is convenient and easy, and ensures that debugging is not on all of the time. There is also a large performance hit when debugging is enabled for a Web project. If Visual InterDev and IIS are on the same machine, it is possible to debug the Inetinfo.exe process as well as the Mtx.exe Web projects. Due to DCOM security constraints on system processes, however, Inetinfo.exe cannot be debugged from a remote machine. To manually enable debugging on a local Web server, steps 1–5 of the following are all that are necessary. For debugging a Web on remote machine, all the following steps are necessary:
- Open the Internet Service Manager in the Microsoft Management Console on the machine running IIS.
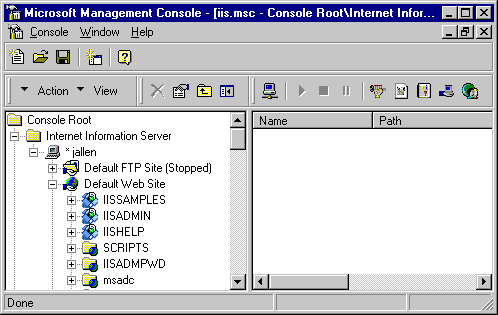
- Expand the Tree View control in the left pane to expose the Webs. Expand the Internet Information Server node, the machine name, and the Default Web Site node. Following is a listing of all the directories in the InetPub\wwwroot directory as well as any application nodes that are pointing at other directories, as in Figure 8.

Figure 8. Directories in the InetPub\wwwroot directory
- Select your application directory in the list and open the Properties for it. Visual InterDev will mark the directory as an application by default, so the icon to the left of the Web will look like a small blue box.
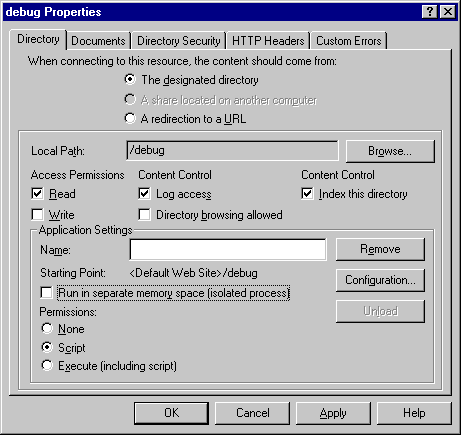
- On the Directory tab (see Figure 9) of the Properties dialog box, click the Configuration button on the lower-right corner of the Application Settings frame. This will load the Application Configuration dialog box.

Figure 9. Directory tab
- In the Application Configuration dialog box, move to the App Debugging tab and select the top two check boxes, as in Figure 10. Click Apply and close the dialog box. The Web is now ready to be debugged in the Inetinfo.exe process by attaching to the process. See the "Attaching to a running process" section later in this document for information about attaching to processes. To debug the Web as a remote Web in Mtx.exe, however, you must complete the rest of the steps.

Figure 10. App Debugging tab
- To begin, the Web needs to be marked as running in an isolated process, or out-of-proc (see Figure 11). This means the Web package will be hosted in Microsoft Transaction Server (MTS), and running as an Mtx.exe child process on the Web server. Click Apply and close the Properties dialog box.

Figure 11. Run the Web in an isolated process
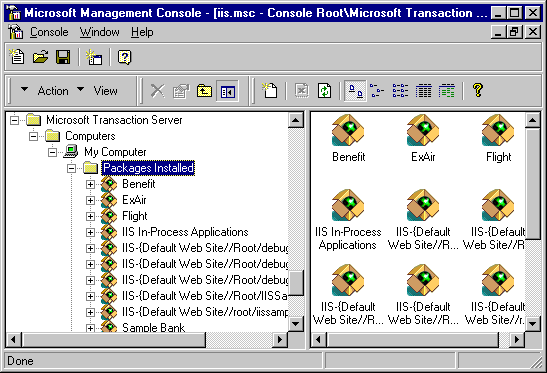
- In the left pane of the Internet Service Manager, expand the Microsoft Transaction Server tree. You will have to click on the node before you can successfully expand it. Next, expand Computers, My Computer, and Packages Installed, as in Figure 12.

Figure 12. Expanded Microsoft Transaction Server tree
- Select the package that is automatically created when you run a Web application out of process and view the properties of that package.
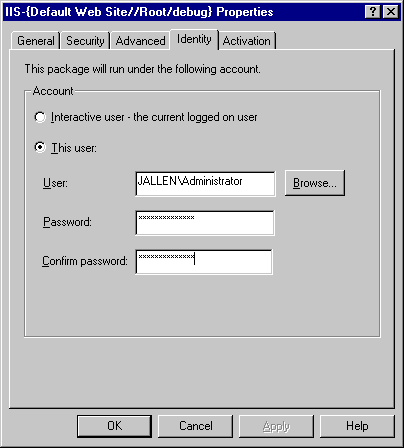
- Click the Identity tab, select the This user option, and enter a valid username and password that belongs to the Administrators group (see Figure 13).

Figure 13. Select "This user" on the Identity tab
Your project is now manually configured to debug. See the section "Attaching to a running process" later in this document to learn how to debug an ASP page.
Debugging Client Script
To debug client script in Internet Explorer, you must be using Internet Explorer 4.0. Debugging must also be enabled in Internet Explorer (this is the default). It is also highly recommended that you set the option in Internet Explorer to launch each new instance of the browser in a new process, and that you do not use Active Desktop™ mode of Internet Explorer when you are debugging.
You can debug client script in any of these ways:
- Run a page containing the client script to debug from within your Visual InterDev solution.
- Attach the Visual InterDev debugger to a process (page) already running in Internet Explorer.
- Respond to a syntax or run-time error in a script, called Just-In-Time debugging.
- Include a statement in script that starts the debugger.
There are also language commands that trigger this mechanism. In Microsoft JScript®, the debugger statement will raise a Just-In-Time exception, and the Stop statement will do the same in Microsoft Visual Basic®, Scripting Edition (VBScript). The two following sections will explain setup and caveats for JIT debugging of client script.
Just-In-Time debugging of client script
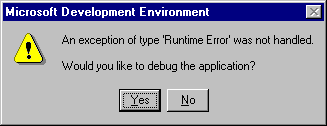
Just-In-Time (JIT) debugging can be very helpful finding trouble spots or exposing exceptions. When JIT is enabled for a language, any compile- or run-time errors will raise an exception. If the debugger is not already attached to the process, a prompt will appear asking if the user wants to debug (see Figure 14). If Yes is the answer, Visual InterDev will launch, attach to the process, and break at the necessary line of script. If No is the answer, the error will be ignored.

Figure 14. Just-In-Time debugging exception
Internet Explorer JIT debugging
JIT debugging with Internet Explorer also requires two settings. First, JIT must be enabled for the machine. Second, the Disable Script Debugging option must not be turned on. This option (highlighted in Figure 15) is located in the Advanced tab of the Internet Options dialog box for Internet Explorer. It should be correctly set by default.

Figure 15. “Disable script debugging” option must not be turned on
When these options are set, Internet Explorer will be ready for JIT debugging. Whenever client-side errors or break statements are hit and no debugger is attached, a dialog box appears asking if you want to debug. However, it has the same problem as ASP debugging with respect to the integrated development environment (IDE). It will always launch a new IDE to debug this process, even if you have an instance of Visual InterDev loaded with the project open. If the project is open, you won't be able to load it into the new IDE also, so you will lose project context while debugging.
Internet Explorer also has a couple of menu commands that might be helpful while JIT debugging. In the View command, under the Script Debugger topic, there are two options: Open and Break at Next Statement. These will both call into the Visual InterDev debugger when it is installed properly. If these options do not work, reinstall Visual InterDev. This is usually caused by another component, possibly the Microsoft Script Debugger, registering itself as the default debugger on the machine. Reinstalling Visual InterDev will refresh the settings and make Visual InterDev the default.
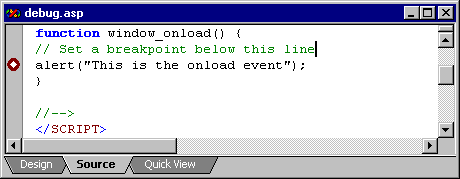
When Internet Explorer requests the file, IIS will generate metadata information that the debugger can use to successfully map the preceding breakpoint to the file Internet Explorer receives. When the debugger breaks, look at the title of the file, where you will see the URL of ClientScript.asp. Notice, also, that all of the ASP code is gone. This window contains Internet Explorer's copy of the ASP page, and a breakpoint has been placed on the line containing the alert, which is now line 14. This is very useful for debugging client script that fires automatically, such as inline code or window events.
Tip When switching between server and client debugging, use the Break command. From the Debug menu, click Processes. In the Processes dialog box, select a process and then click Break. This will break the debugger at the next code that runs in that process, giving you more control than just using the Break command from the Debug menu. This makes it easy to control the context changes that occur when moving from ASP to client script and easier to debug a scenario that involves both.
Note Client breakpoint mapping from ASP will usually fail if the file is edited during the debugging session. To avoid this, use the Restart command from the Debug menu after you edit the ASP code. The debugging session will shut down completely and a new session will begin immediately. This will force all of the changes to be registered and the new files will be used to calculate the breakpoint mapping.
Note To Beta Users Previously, this feature could be used only when the Enable ASP client debugging option was selected. Many people did not understand what this meant and assumed it was needed for all client script debugging. To clear up the confusion, this was removed as a separate option and incorporated into the Server Debugging option.
Setting client script breakpoints in ASP script
An ASP file can produce very different results, and the output generally bears little resemblance to the original source code. This causes a problem when trying to debug client-side script that is part of the ASP, because the user must open the file from the Running Documents tree and then try to debug it. This isn't practical and can cause problems when trying to debug window_onload() or similar events.
To work around this, Visual InterDev supports automatically mapping breakpoints in client script from the ASP source to the ASP output. These mapped breakpoints are noticeable in the ASP source code because they show up as breakpoints with a white diamond in the middle of them.
For this to work properly, ASP Server-Side Script Debugging must be enabled because IIS is responsible for generating the necessary mapping information. The setting is turned off by default. When Visual InterDev automatically enables server debugging, however, the proper setting is turned on and this feature will work. Here is an example:
- Insert the ClientScript.asp file, available in the downloadable .zip file included with this article, into your Web project.
- Scroll to line 24 and set a breakpoint; it should look like Figure 16.
- Now set ClientScript.asp as the start page and begin debugging.

Figure 16. ClientScript.asp
Debugging client script within a solution
If you are working in a Visual InterDev solution, you can debug a file by launching the debugger. Use the following steps to debug a script from within a solution:
- In Visual InterDev, open the project containing the page you want to debug and load the page into the editor.
- Make the page your project's start page. In the Project Explorer, right-click the page and click Set as Start Page.
- Set a breakpoint in the script to debug.
- From the Debug menu, click Start.
- If debugging for client script in ASP pages has not been enabled as just described, Visual InterDev displays a message. Here are your options:
- If you are working with client script in an .htm file (not an .asp file) and you will not be navigating to an ASP page during your debugging session, click No to proceed with debugging.
- If you are working in an .asp file or you will be navigating to an .asp file during your debugging session, click No to proceed only if you are certain that debugging has already been manually enabled on the server for your project. Click No also if you are debugging locally and want to attach to the Inetinfo.exe process rather than the Mtx.exe process. Otherwise, click Yes and the server will automatically set up debugging.
- If the Automatically enable ASP server-side debugging on launch option is selected or if you click Yes and this is the first time you have launched a debugging session since opening the project, you are prompted to provide user information that identifies the debugging process on the server. (You are prompted even if you are currently working with an .htm file, in case you navigate to an ASP page.) Enter your domain and name in the form DOMAIN\username and your password.
Note You might experience a delay the first time you launch a debugging session for the current project while Visual InterDev establishes the proper debugging configuration on the server.
Visual InterDev launches Internet Explorer and loads the page into it. When Internet Explorer reaches the breakpoint, it stops and displays the source code in the Editor window. If the breakpoint is in an event handler script, you must trigger the event to reach the breakpoint.
- If you find an error, fix it and save the file. If you do not have a working copy of the file, right-click the name of the file in the Project Explorer and click Get Latest Version before you make modifications.
- From the Debug menu, click Restart.
Debugging client script in a running document
If a client script is already running in Internet Explorer and you detect a problem, you can stop the script and debug it on the spot. You can debug a running document from within Visual InterDev or from within Internet Explorer.
Note If you are working with an ASP page, debugging must be enabled on the server. For details, see the section "Manually Enabling ASP Debugging." earlier in this document.
You can attach to a running document only if attaching is enabled. Use the following steps to enable JIT debugging:
- From the Tools menu, click Options.
- In the Options dialog box, click Debugger.
- Under Script, select Attach to programs running on this machine.
You can attach to a document directly in Visual InterDev. Use one of the following steps to debug a running document in Visual InterDev:
- In Visual InterDev, click Processes from the Debug menu. In the Processes dialog box, click Microsoft Internet Explorer, Attach, and set a breakpoint in the script you want to debug.
–or–
- If you have already attached to a running document, in Visual InterDev click Break from the Debug menu. The debugger will stop at the next script statement that is executed.
If Visual InterDev is not already running, you can launch the debugger from Internet Explorer. Use the following steps to debug a running document from Internet Explorer:
- In Internet Explorer, click Script Debugger from the View menu, and then select Break at Next Statement. In the browser, trigger the event that calls the script you want to debug.
–or–
In Internet Explorer, click Script Debugger from the View menu, and then select Open.
A new instance of Visual InterDev is launched and you are prompted to open a project. If Visual InterDev is already running, a second instance is launched.
- Open the project containing the file to debug. If the project is already open in another instance of Visual InterDev, you can't open it again, so Visual InterDev creates a new solution and project instead.
The page to debug is loaded into the editor. If necessary, get a working copy of the page. If the project was already open, the page is loaded as read-only file in the new project.
If you make changes to the file, save it and redeploy it to the server. Refresh the file in Internet Explorer before running the script again.
Debugging client script in response to an error or debugger statement
If Internet Explorer encounters a syntax or run-time error, you can use JIT debugging to find and fix it. You can also include a statement in your script, such as a Stop statement in VBScript or a debugger statement in JScript, to launch the debugger from within a script.
You can launch the debugger in response to an error or debugger statement only if JIT debugging is enabled. Use the following steps to enable JIT debugging:
- From the Tools menu, click Options.
- In the Options dialog box, click Debugger.
- Under Script, select Just-In-Time debugging.
Use the following steps to debug in response to an error or debugger statement:
- When Internet Explorer encounters an error or a statement that starts the debugger, it displays an error message prompting you to debug. Click Yes. A new instance of Visual InterDev is launched. If Visual InterDev is already running, a second instance is launched.
- Open the project containing the file to debug. If the project is already open in another instance of Visual InterDev, you can't open it again, so Visual InterDev creates a new project instead.
- The page to debug is loaded into the editor. If necessary, get a working copy of the page. If the project was already open, the page is loaded as a read-only file in the new project.
Note If you are debugging a client script generated by an .asp file, the line numbers reported in error messages refer to lines in the HTML document currently displayed in the browser. These usually do not correspond to line numbers in the original .asp file, because server script does not appear in the HTML output of an .asp file.
If you make changes to the file, save it and redeploy it to the server. Refresh the file in Internet Explorer before running the script again.
Debugging Projects in Local Mode
Local mode is a Web project mode available in Visual InterDev that moves your project to a "sandbox" that uses the Web server on the local machine. This is convenient because you can make changes to a Web site without affecting anyone else or breaking the application. When the necessary changes have been made and everything has been verified to work correctly, switching back to Master mode will update the Web site with the changes.
Local mode has its own advantages versus debugging a remote server. This is because all ASP executions are serialized when debugging is enabled for a Web. The effect is that outside users browsing the Web will not receive an ASP page until you have stepped out of the current file, and IIS is in Run mode. Conversely, random ASP requests from other users may cause confusion for you when stepping between files while trying to re-create a complex scenario. By moving the project mode to your sandbox, the environment is restricted from possible outside interference.
Local mode debugging is also a better experience because shutting down the debugger occurs more quickly on local servers than remote servers. When a debugging session is ended, Visual InterDev will connect to the server to disable the debugging settings. If the Visual InterDev client and the Web server are on separate machines, this might take a few minutes because there are several DCOM requests that may go unanswered. Visual InterDev may appear hung, but it is really just waiting for these calls to timeout. When using Local mode, however, this is not a problem because the timeouts never occur.
Debugging Server Script
Changing a machine's script debugging and JIT properties
Each Windows machine that has Visual InterDev or IIS and the Remote Machine Debugging component installed has properties for debugging the Script and Java languages. Visual InterDev allows you to change this property on remote machines, but you must be an administrator on the remote machine to do this. Use the following steps to adjust these machine-specific settings:
- Launch Visual InterDev 6.0.
- From the Debug menu, click Processes.
- Type the target machine name into the Machine combo box.
- Click Properties.
- In the Debugger Properties dialog box for the machine (see Figure 17), verify that the Attach to running programs option is selected for Script. If you want JIT debugging, turn it on now. You can also choose to turn Java debugging and JIT on or off.

Figure 17. Select the “Attach to running programs” option
Server-side ASP JIT debugging
There are only two requirements for getting server-side JIT debugging to work, but there are some important side effects to consider. First, JIT must be enabled for the machine the server is located on. (See the section "Changing a machine's script debugging and JIT properties" immediately preceding this section.) Second, debugging must be enabled for the Web. You might notice that Visual InterDev's auto-enable server debugging feature does not support these requirements, because by default it will disable debugging for the Web after each session. This is intended because JIT debugging for server-side script can have some unintended consequences, and it was decided the majority of users would prefer to avoid these.
For example, let's consider a remote Web server that was manually enabled for debugging. If JIT for that machine is turned on, any errors or break statements will cause the JIT dialog box to appear on the Web server. This means you must physically be at the machine to answer Yes or No to the dialog box each time an error occurs, which is less than ideal. Using Visual InterDev's auto-enable server debugging feature avoids this by making sure that the Web has debugging enabled only when the remote debugger is attached.
Another oddity of ASP debugging is that compile/preprocessor errors report differently than run-time errors. Run-time errors return a dialog box and break into the debugger, where compile errors just send error text to the browser. This is because of the "remote debugging" functionality of Visual InterDev 6.0. If IIS returned a dialog box as well as breaking into the debugger, you would have to physically walk to the Web server to clear the dialog box before debugging could continue.
The last possible confusion caused by ASP JIT debugging is with the Visual InterDev IDE. As per the behavior of past Microsoft development tools, Visual InterDev launches a new copy of the IDE for every new JIT debugging session, even when a copy of Visual InterDev already has the correct project loaded. If the project is already loaded in another copy of Visual InterDev, you won't be able to open it in the new one, and thus you won't get the project context while debugging your site. This is another reason that makes it preferable to use the project debugging features rather than JIT.
Remote Debugging
In addition to debugging scripts and processes that are running on your computer, you can debug those that are running on another computer. This is referred to as remote debugging. In Visual InterDev, Remote Debugging is useful for debugging server scripts running in ASP pages on IIS.
Ordinarily, to debug server script in an ASP page, you would have to install Visual InterDev on the server and then debug scripts locally on that server. However, with Remote Debugging you can attach the debugger running on your computer to a script running on the server and issue debugging commands across the network.
Note If IIS and Visual InterDev are running on the same computer, you can debug server scripts using that copy of Visual InterDev, without Remote Debugging.
For the most part, Remote Debugging is similar to debugging locally, except for these differences:
- You must perform some extra setup steps before you can use Remote Debugging (see "Setting Up Remote Debugging").
- Only one user can use Remote Debugging on a server at a time.
- You can attach to the Mtx.exe process only when debugging remotely.
- After the server has been configured for Remote Debugging, you can debug on the server in much the same way you do locally.
Note It is highly recommended that you do not use Active Desktop mode of Internet Explorer 4.0 when you are debugging.
Note Because Remote Debugging ties up process threads on the server, it is recommended that, while a Remote Debugging session is in progress, other users avoid using the server.
There are two ways to start Remote Debugging:
- Launch a project using the debugger. This works just like debugging locally except that Visual InterDev automatically attaches the debugger to the server and starts Remote Debugging.
- Attach to a process that is already running on the server. This is useful if you become aware of a server script problem while the application is running. You can detect an error in server script if the server returns error text instead of your page, or if the browser appears hung when you request an .asp file.
If you launch a project using the debugger, you can start debugging at the first line of script. Otherwise, you will only be able to debug script that runs after you attach to the process. In addition, if you launch a project, you will be able to edit the files you are debugging. When you attach to a process, you can see the files you are debugging, but cannot edit them there.
Launch a project using the debugger
- In Visual InterDev, open the file to debug and, if needed, set breakpoints.
- Make the page your project's start page. In the Project Explorer, right-click the page and select Set as Start Page.
- In the Launch tab of the project's properties, select the Automatically enable ASP server-side debugging on launch option.
Note If this option is not selected and it is the first time you have launched a debugging session since opening the project, a dialog box appears (see Figure 18) asking if you want to enable ASP debugging. If you select Yes, Visual InterDev will automatically set up the server for Remote Debugging. Select No only if you have manually configured the server for Remote Debugging or if you don't want to enable debugging.

Figure 18. Enable ASP debugging dialog box
- From the Debug menu in Visual InterDev, select Start.
Note If another user is already debugging on the server, Visual InterDev displays an error message, and you will not be able to start the debugger.
- If this is the first time you have started the debugger since opening the current project, you are prompted to provide user information used to identify the debugging process on the server.
- Enter the domain and name (in the form DOMAIN\username) and password of a user with administrative privileges. For more details, see "Setting Up Remote Debugging" earlier in this document.
- After the debugger starts and attaches to the document, proceed with debugging as normal.
Attaching to a running process
If debugging has been manually enabled on the server for your project and you detect an error while the application is running, you can attach the debugger to it.
Use the following steps to attach to a running process:
- If it is not already open, start Visual InterDev.
- From the Debug menu, click Processes.
- In the Processes dialog box, type the name of the computer to attach to. If you don't know the computer name, choose Machine and use the Browse for Computer dialog box to locate the server where you want to debug.
- In the machine processes list, select the Mtx.exe process, and then click Attach.
Note If you want to debug client script as well as server script, you will need to attach to the Iexplore.exe process also.
- The process you selected appears in the Debugged Processes list. Close the Processes dialog box and use the Running Documents window to select the ASP page to debug.
- You can step through scripts and test variables and expressions normally. However, to run a page you must navigate to it in your browser. In addition, you can't edit the pages that you are debugging.
Common Problems
This section describes some of the problems you may encounter while debugging with Visual InterDev 6.0, along with possible workarounds.
The project is not set up to enable ASP debugging automatically
The dialog box in Figure 19 appears if you have the EnableServerDebugging project option set to false. To toggle this option to true, select Yes. This means Visual InterDev will ask you to log on with a user account that has permission to debug and will enable ASP debugging on the current Web. Selecting No will leave the property's value as false and launch the debugger. It does not try to enable ASP debugging for the Web, but leaves it in the current state and tries to attach. Cancel will cancel the Debug Start command and return you to the IDE.
Unable to set up server automatically
When you start debugging, the dialog box in Figure 19 appears.

Figure 19. Unable to set server error message
This error can be caused by one of two things:
- If you are Remote Debugging, the client machine might not have the needed IIS components. Make sure at least the minimum IIS components are installed on the client machine. These are listed in the "Setting Up Remote Debugging" section of this document.
- The Remote Machine Debugging component install has failed. On the server, install the Remote Machine Debugging component again. The stand-alone setup for this component is located in the Scrpt_ss directory on CD1 of Visual InterDev Professional Edition or CD2 of Visual Studio Enterprise Edition. After this has set up, reboot and try again. If the problem persists, hand-register the two Registry files, Mtsadmin.reg and Mtsadmin2.reg, included in the downloadable .zip file, by double-clicking them.
Debug user name or password not valid
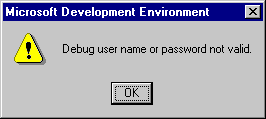
After logging on to the debugging dialog box prompt, you get the following message box (see Figure 20).

Figure 20. User name or password not valid error message
This means the domain and/or user account information is incorrect. Verify that the domain and user names are correct, and make sure the password is entered correctly.
Note The occurrence or absence of this dialog box means only that the network logon has failed or succeeded, respectively, not necessarily that debugging has correctly been enabled.
Cannot attach to machine
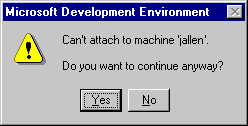
After you start debugging, the error message in Figure 21 appears when the user attempting to debug does not have the proper permissions to attach to the remote machine. Verify that the account you are logging on with has proper permissions to debug the machine running IIS.

Figure 21. Can't attach to remote machine
ASP breakpoints ignored
There are several possible reasons for why the ASP breakpoints are ignored:
- If the breakpoints appear with question mark ("?") symbols in them after they have been missed, you need to install the ASP Hotfix or Windows NT 4.0 Service Pack 4.
Note When installing the ASP Hotfix, make sure to stop all Web services and then run the install. To make sure the ASP Hotfix installed correctly, look at the size of the Asp.dll (c:\winnt\system32\inetsrv). The correct size is 323 kilobytes.
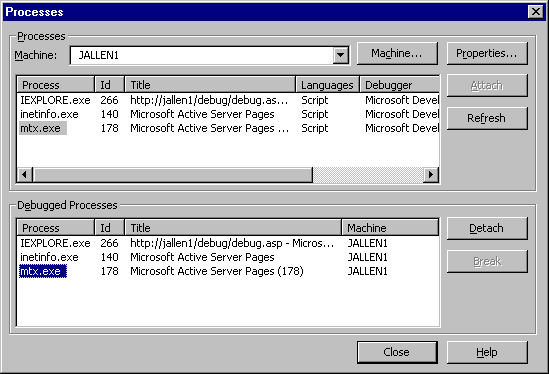
- If the breakpoints do not have the question mark symbols in them, the current user account may not have sufficient permissions to debug the ASP process. Make sure the logged-on user has the necessary permissions, which are documented in the "Giving users permission to debug" section of this article. If the problem persists, open the Processes dialog box from the Debug menu, as in Figure 22. Look in the list of processes and see if Mtx.exe is available on the server. If it is not, there is still a permission problem, and you should double-check the different permissions.

Figure 22. Processes dialog box
- Breakpoints will not work correctly when debugging against an SSL Server. Debugging will launch and the Running Documents window will show the ASP process, but the breakpoints set in the project files will not be hit. To hit breakpoints when debugging an ASP on an SSL server, view the ASP page in the browser, and open the file from the Running Documents window. Any breakpoints set in this copy of the file will be hit when the ASP is run again. This is a known bug in IIS and will be addressed by Windows 2000.
Internet Explorer breakpoints ignored
Client-side breakpoints are ignored because Internet Explorer 4.0 does not properly handle included files for debugging. The DTC script library code is an example of this, because it is included in your HTML files via the <SCRIPT SRC="filepath.htm"> tag. If you open Filepath.htm in the Project Explorer and set breakpoints in it, they will be ignored.
To debug code that has been included using the <SCRIPT SRC=''"> tag, open the Running Documents window, and expand the Internet Explorer node. Underneath the root document are several nodes that are listed as Jscript – window script block (see Figure 23).

Figure 23. Running Documents window
Each of these nodes represents a different included file that contains the DTC script. Double-clicking will open up a read-only version of the file in which you can set breakpoints. To edit, however, you must still use the Project Explorer version of the file.
Note Microsoft does not recommend nor support making changes to the DTC Script Library. This is a problem with Internet Explorer 4.0 that will be fixed for Internet Explorer 5.0.
Source code is not available for the current statement
The dialog box in Figure 24 appears when the debugger can't find what code to map the current statement to. There are several things could cause this:
Debugger breaks into unrecognizable code
While debugging, you might break into some unrecognizable code that is looking for a proxy. This is Internet Explorer proxy code that is contained in Shdocvw.dll. This is a .0 5. Internet Explorer runs this code on startup if the Automatic Configuration setting is selected. This is not easily reproducible, but does happen consistently for some people. If this is annoying and you can live without the Automatic Configuration option, you can turn it off through the Connection tab on the Internet Explorer Internet Options dialog box.
Debugger hangs when ending a session
When ending a Remote Debugging session, there are several DCOM calls made that might time out. During these timeouts, the debugging facilities are unavailable. The IDE, however, should return to proper working order, although you might notice that the Start and End debugging toolbar items are grayed out, and the Break symbol is now enabled. Unfortunately, this is the only feedback that is given for this state. Occasionally, the IDE will hang for a short time (two to three minutes) before returning.
Internet Explorer times out while in a debugging session
When debugging a page, Internet Explorer 4.01 Service Pack 1, or earlier, times out after exactly five minutes (see Figure 25). This means you have only five minutes to finish your debug issue if you want to see the returned page to the browser. The problem will be fixed in Internet Explorer 5.0, or you can run a search on the title of the Knowledge Base article Q181050: "Microsoft Internet Explorer Error 10060 Connection..." The article describes how you can increase your browser timeout value.

Figure 25. Internet Explorer times out during debugging
IIS serves up blank ASP pages
Sometime during or after a debugging session viewing an ASP page in Internet Explorer the page comes up blank, or when debugging a page it contains a comment similar to "<!- META ASPDEBUGINFO=1 ->." It is not yet clear why this happens but it seems to be a problem with IIS. Some have been successful with the following workaround:
- Shut down the WWW service.
- Disable debugging by reversing the steps in the "Manually Enabling ASP Debugging" section in this document.
- Unload the Web application by clicking the Unload button in the application Properties dialog box.
- If this does not work, a reinstall of IIS may be necessary.
Line numbers seem wrong on server-side error messages
When browsing a page that contains wrong syntax or some type of problem that will cause an error to display in the browser, the line number in the error message may seem to be wrong (for example, you don't have that many lines in your ASP page). If the ASP page contains preprocessor <#INCLUDE> statements, the line number will be off by the number of lines in the include file.
Note When using the Visual InterDev 6.0 Script Library, include files are added into your ASP page automatically.
Note The user that is logged on when Setup runs will automatically be given permission to debug on that machine.
- Select the following options:
- Windows NT 4.0 Option Pack
- Microsoft Data Access Components
- Remote Machine Debugging
- FrontPage Server Extensions
- Visual InterDev Server
- Before you click Next, expand the Windows NT 4.0 Option Pack node. In addition to the options selected by default, select the Visual InterDev RAD Remote Deployment Support node. Then expand the Visual InterDev RAD Remote Deployment Support node and select the second instance of Visual InterDev RAD Remote Deployment Support. Make sure Visual InterDev RAD Remote Deployment Support is selected at both levels.
- Remote Machine Debugging is another component of the BackOffice Server Wizard. Although the debugging components have already been set up by the Visual InterDev client, Remote Machine Debugging also registers some registry keys that allow Visual InterDev to debug the Transaction Server processes. The setup for this is located in the Scrpt_ss directory on CD1 of the Visual InterDev Professional Edition install, or CD2 of Visual Studio Enterprise Edition.
- From the Start button, click Run on the server computer.
- Type Dcomcnfg.exe and click OK.
- On the Applications tab, find Catalog Class (see Figure 1) and click the Properties button.
Note The Catalog Class item is installed with the BackOffice Installation Wizard and is part of the server components for Visual InterDev 6.0.
- This will open a dialog box titled Catalog Class Properties with four tabs. Click the Security tab.
- Select Use custom access permissions and click Edit (see Figure 2).
- This launches the standard Windows NT Add/Remove users dialog box (see Figure 3). You can now add or remove any Windows NT user accounts or groups that you wish to have or deny permission. (The simplest way is to add the Administrators group because in step 1 you added all of the users that you want to Remote Debug into this group.)
Note Due to a Windows NT bug, the Interactive User account will not work for granting debugging access. Users logged on to the server will not be able to debug even though this would seem to allow it. This should be fixed in Windows NT 4.0 Service Pack 4.
- Click OK when you are finished making changes.
- Repeat steps 5–8 for the Use custom launch permissions option.
- Click OK to close the Catalog Class Properties dialog box, select the Machine Debugger Manager from the Applications tab list box, and click the Properties button (see Figure 5).


