Programmers can use several tools to trace the SQL statements received and generated by the SQL Server ODBC driver. They can also use the Windows NT Performance Monitor and SQL Server ODBC driver profiling features to analyze the performance of the driver.
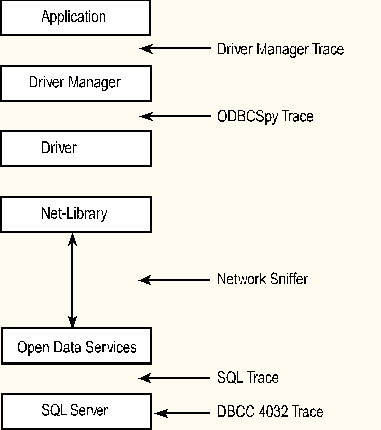
Microsoft SQL Server and ODBC offer several points at which users can trace the SQL statements on their journey from the application to SQL Server, as shown in the following illustration:

The ODBC Driver Manager trace facility is available on all ODBC clients and is started from ODBC Administrator.
To start trace from ODBC Administrator
The ODBC trace facility traces all calls made to any ODBC data source on the client. It records ODBC calls immediately after they come into the Driver Manager from the application. This is helpful in debugging problems that the Driver Manager may have when connecting to a driver.
This is a fairly minimal trace, however, and is used only when the second tool, ODBCSpy, is not available.
Here's an example of an ODBC Driver Manager trace output:
SQLAllocEnv (phenv00145E08);
SQLAllocConnect (henv00145E08, phdbc00145878);
SQLDriverConnect (hdbc00145878, hwnd00870544, "DSN=ab60def;UID=sa;PWD=;", -3, szConnStrOut,0, pcbConnStrOut, 1);
SQLError(henv00000000,hdbc00145878,hstmt00000000, szSQLState, pfNativeError, szErrorMsg, 512, pcbErrorMsg);
SQLAllocStmt(hdbc00145878, phstmt0014A990);
SQLExecDirect(hstmt0014A990, "select * from discounts",    -3);
A lot of information is missing from this output. There is no indication of the return code for each function call. There is no way to tell if the SQLDriverConnect call was successful; however, the fact that the next call was to SQLError could indicate some problem. Since the trace does not show what szErrorMsg string or SQLState value was returned by SQLError, there is no way to tell what the problem might have been. The fact that the application went on to allocate a statement handle and execute a statement seems to show that no major problem was encountered.
When Driver Manager tracing is on, all calls to ODBC drivers on that client are traced. There is no way to trace only a specific data source.
The ODBCSpy utility ships with the ODBC SDK and can be used to get an informative trace of all the ODBC calls made to a specific ODBC data source. ODBCSpy traces calls as they are passed from the Driver Manager to the ODBC driver. It shows all of the parameters passed for each call to the driver and the information returned from the driver. If an error is encountered, ODBCSpy calls SQLError for all error messages returned and logs all information about the errors in the trace.
Here's an ODBCSpy trace of the same SQLError call traced in the example above:
SQLError
   NULL
   0x01010000
   NULL
   [5]01000
   5701
   [85][Microsoft][ODBC SQL Server Driver]
      [SQL Server] Changed database context to 'master'
   512
   85
   SQL_SUCCESS
This trace output includes more useful information. It shows that the SQLError function itself returned SQL_SUCCESS. (The entry for SQLDriverConnect would have shown that it returned SQL_SUCCESS_WITH_INFO, not SQL_ERROR.) The trace also shows that SQLError returned a SQLState of 01000, a pfNative of 5701, and a szErrorMsg string that indicates SQL Server has changed the connection context to the master database.
There are also third-party ODBC tracing tools available.
SQL Trace, a trace utility introduced in SQL Server 6.5, uses Open Data Services to intercept and trace all SQL statements coming in to SQL Server. SQL Trace is extremely valuable for determining if a problem is due to the Transact-SQL statements the driver generates to support the ODBC commands coming from the application. A programmer can use ODBCSpy to see exactly what comes from the application to the SQL Server ODBC driver, and then use SQL Trace to see what the driver actually sends to the server.
If an application does:
SQLExecDirect(hstmt, "exec sp_helpdb 'pubs' ", SQL_NTS);
SQL Trace shows:
-- 1/29/97 17:13:23.530 SQL (ID=3, SPID=12, User=sa(MyDomain\MyNTAccount), App='Microsoft ODBC SDK v2.0', Host='MyServer'(d3) )
exec sp_helpdb 'pubs'
go
SQL Trace can be used to dynamically trace statements coming in from different clients to a server. Sites that have servers earlier than SQL Server 6.5 can use an older, unsupported version of the utility called SQLEye. SQLEye is available on the Microsoft TechNet compact disc.
SQL Server has a DBCC trace flag (4032) that causes the server to trace incoming SQL statements. SQL Trace is much easier to use, so sites that have SQL Trace or SQLEye generally use those tools instead of the trace flags.
When a user sets the 4032 trace flag, the user also generally sets a couple of other trace flags to control the trace:
To have SQL Server trace all SQL statements from all clients to the error log:
SQLExecDirect(hstmt, "dbcc traceon(3605, 4032, -1)", SQL_NTS);
For more information about trace flags, see the SQL Server documentation.
Windows NT Performance Monitor is a powerful tool for profiling the performance of SQL Server applications. SQL Server installs several counters in Performance Monitor (for more information, see the Microsoft SQL Server Administrator's Companion). In SQL Server 6.5, users can also add up to 10 user-defined counters (for more information, see What's New in SQL Server 6.5). To get a better idea of how your query impacts the operation of the server, use the SQL Server counters in Performance Monitor to track the resources used by your application.
The SQL Server ODBC driver version 2.65.0201 and later offers a couple of features that aid in analyzing performance of ODBC applications:
Applications can request that the driver write all queries whose response exceeds a specified time limit to a file for later analysis by the programmer and database administrator. The log can be turned on in two ways.
An application dynamically setting the profiling options first specifies the file to use for the log by executing:
SQLSetConnectOption(hdbc,
         SQL_COPT_SS_PERF_QUERY_LOG,
         (ULONG)"c:\\odbcqry.log");
It then sets the interval by executing:
SQLSetConnectOption(hdbc,
         SQL_COPT_SS_PERF_QUERY_INTERVAL,
         1);
The number specified is in seconds, so the call shown above causes all queries that do not return within one second to be logged.
Note: The query profiling interval in a data source is specified in units of milliseconds.
After these options are enabled, the application can turn logging on and off dynamically by executing:
SQLSetConnectOption(hdbc,
         SQL_COPT_SS_PERF_QUERY,
         SQL_PERF_START);
SQLSetConnectOption(hdbc,
         SQL_COPT_SS_PERF_QUERY,
         SQL_PERF_STOP);
Note that this option is global to the application; therefore, after the option has been started for any of the SQL Server ODBC connections, long-running queries from all SQL Server ODBC connections open from the application are logged.
Applications can request that the driver log performance data for the driver. As with long-running query logging, the performance log can be turned on either by the application or by specifying performance logging in the data source using ODBC Administrator. For more information, see "Setup and Connecting."
When dynamically turning on performance logging by calling SQLSetConnectOption, applications can either write the performance data to a log file or read the data into the application using a sqlperf structure defined in the Odbcss.h header file.
The following commands start and stop performance-data gathering:
SQLSetConnectOption(hdbc,
         SQL_COPT_SS_PERF_DATA,
         SQL_PERF_START);
SQLSetConnectOption(hdbc,
         SQL_COPT_SS_PERF_DATA,
         SQL_PERF_STOP);
Performance statistics are recorded in a data structure named sqlperf (for an explanation of the sqlperf variables, see the appendix). The statistics are global for all connections made through the driver by the application. For example, if the application starts the performance statistics and opens three connections, the statistics are global for all three connections.
If an application wants to log performance data to a file, the following command creates the log file:
SQLSetConnectOption(hdbc,
         SQL_COPT_SS_PERF_DATA_LOG,
         (ULONG)"c:\\odbcperf.log");
The log file is a tab-delimited text file that can be opened in Microsoft Excel (specify tab delimited in the wizard that appears). Most other spreadsheet products also support opening a tab-delimited text file.
The following command writes a record to the performance log, with the current contents of the data structure recording the performance data:
SQLSetConnectOption(hdbc,
         SQL_COPT_SS_PERF_DATA_LOG_NOW,
         (ULONG)NULL);
The application does not need to set up a performance log; it could instead pull the performance data by using SQLGetConnectOption to get a pointer to the sqlperf structure. This structure is declared in a typedef in the Odbcss.h header file. The following statements are an example of pulling the statistics into the application:
SQLPERF *PerfPtr;
// Initialize PerfPtr with pointer to performance data.
SQLGetConnectOption(hdbc,
         SQL_COPT_SS_PERF_DATA,
         &PerfPtr);
printf("SQLSelects = %d, SQLSelectRows = %d\n",
         PerfPtr->SQLSelects, PerfPtr->SQLSelectRows);
If the application uses a data source that has the performance-statistics profiling option activated, the driver writes the statistics header information to the log file and starts accumulating the statistics in its internal data structure when the application makes its first connection using the driver. When the last connection to the SQL Server ODBC driver from the application is closed, the driver writes out the global, accumulated, performance statistics.
The fact that profiling is global to the driver governs the behavior of the log files. When an application connects to a data source that specifies profiling, the driver starts a log file and begins logging information from all connections active from the application to the SQL Server ODBC driver from that point forward. Even connections to SQL Server data sources that do not specify profiling are recorded because the profiling is done globally for the driver.
If the application does a SQLFreeEnv, the ODBC Driver Manager unloads the driver. At this point, both the long-running query log and the performance statistics logs hold the information from the old connections. If the application then makes another connection to the data source that specifies profiling, the driver is reloaded, and it overwrites the old copy of the log file.
If an application connects to a data source that specifies profiling, and then a second application connects to the same data source, the second application does not get control of the log file and therefore is not able to log any performance statistics or long-running queries. If the second application makes the connection after the first application disconnects, the driver overwrites the first application's log file with the one for the second application.
Note that if an application connects to a data source that has either the long-running query or performance statistics enabled, the driver returns SQL_ERROR if the application calls SQLSetConnectOption to enable logging. A call to SQLError then returns the following message:
SQLState: 01000, pfNative = 0
szErrorMsg: [Microsoft][ODBC SQL Server Driver]
            An error has occurred during an attempt to access
            the log file, logging disabled.