Rick Anderson
Microsoft Corporation
March 1999
Summary: Discusses how to add a counter alert to the Microsoft® Windows NT® Performance Monitor application, and how alerts can be used to prevent resource usage problems from causing your system to crash. (16 printed pages) Includes:
Introduction
The PerfMon Application
Alerts
The Smart Alert Architecture
Alerts to the Rescue
I frequently get customer calls complaining of a resource leak. When I ask them to check the application event log (Start \ Programs \ Administrative tools (Common) \ Event Viewer) they reply they can't, as the system is rebooting or locked because it ran out of [fill in the blank: memory, handles, temp space, disk space, connections]. Even though they've known about the problem for some time, they often forget to restart the leaky application before system resources are exhausted.
There is no need to ever have a Windows NT computer run dangerously low on resources. You can easily add a counter alert to PerfMon that will notify you before disk, memory, or other critical resources get dangerously low. While PerfMon can't always predict the future, it can warn you in time to stave off impending doom.
We discussed the performance graphing features of PerfMon in my article "Your Right To Know, Part I: Finding Leaks and Bottlenecks with a Windows NT PerfMon COM Object." But most people—even those who use PerfMon—don't know about its alerting and logging mechanisms. So this time we will cover alerts, which enable PerfMon to notify us when any counter we select goes above or below a specified limit. If you're already familiar with alerts, skip the introduction and go to "The Smart Alert Architecture" section later in this article.
The PerfMon utility is really four separate applications with a View menu that lets you select the chart, alert, log, or report application. Even though these are independent functions and not views on the same data set, they are documented as views. (A real view would allow you to view the same data differently, depending on the view selected.) If you want to view the counter "\Processor\Interrupts/sec" in each view, you will have to add the counter to each view. Each PerfMon view will independently collect the counter data, even though you can only see one view at a time. The four views are:
Once you set up PerfMon with the counters and options you like, you should save the settings with Save xxx View Settings on the File menu (where xxx is one of Chart, Alert, Log, or Report). You can save all the view settings in one file with Save Workspace on the File menu.
The Performance Monitor application has an alert feature that allows you to specify one or more of the following actions to be taken when a counter value is exceeded:
PerfMon can check alert values periodically (defaulting to every five seconds) or it can check only when you manually select Update Now from the Options menu.
The Run Program argument may be specified differently for each counter, while the remaining options apply to all the counters in the PerfMon instance. It would be much more useful to specify the update rate, application event logging, and network notification on a per counter basis, but this can only be done by running one instance of PerfMon for each counter.
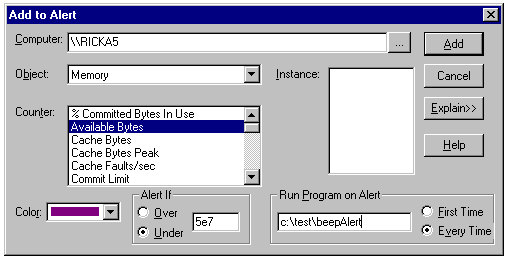
Suppose I wanted to be alerted when available memory on RICKA5 fell below 50 MB. I would start Performance Monitor (in this case on RICKA4, my primary computer) and select Alert from the View menu. Next, I would select Add to Alert... from the Edit menu. Figure 1 shows the completed dialog box.

Figure 1. The completed Add to Alert dialog box
I have also specified that it should run program "c:\test\beepAlert.exe" every time there is a PerfMon update where the alert condition is met (in this case less than 50 MB of virtual memory free). Now I can run several leaky applications on RICKA5 and be notified in time to stop them before the system runs out of memory and locks up.
Selecting Alert... from the Options menu brings up the Alert Options dialog box.
Figure 2 shows the alert options I have selected.
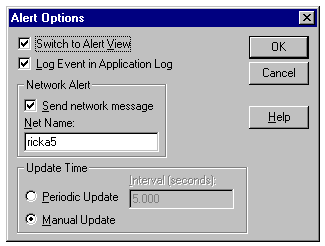
Figure 2. The Alert Options dialog box with all options satisfied
Each time an alert condition fires, the beepAlert program runs (which simply beeps and exits), PerfMon switches to Alert view, the alert message is put in the Application event log, and the alert message pops up on computer RICKA5.
While experimenting with alerts, it's very important to select Manual Update; otherwise your event log will get flooded and you will have thousands of "Messenger Service" dialogs to dismiss and potentially thousands of programs running.
Figure 3 shows the Event Detail dialog box of an event PerfMon logged. In this case I had set an alert to fire when the free disk space dropped below 50 percent. The event detail, network alert message, and command-line argument passed as argv[1] of main to the program that's run all contain exactly the same information.
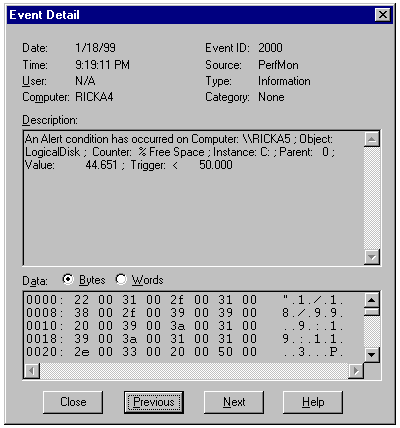
Figure 3. The Event Detail dialog box
Notice I have also checked Send network message to the computer RICKA5.
Figure 4 shows an alert message that popped up on RICKA5. In this case I set an alert to notify me when the paging file usage on RICKA4 exceeded 10 percent usage of the currently allocated paging file(s). PerfMon separates each field in the counter path string by commas. % Usage is the counter, Total is the instance, the blank field is parent (most counters don't have a parent), Paging File is the object, and RICKA4 is the computer.
The parent field here refers to a parent of a counter instance, not to the parent of a Windows NT object. An example of a counter instance that has a parent is a thread, whose parent is its process instance. Because a thread is contained in a process, identification of a unique thread requires identification of the process in which it's contained.

Figure 4. Alert Message from PerfMon
After you get the alert options you like, save your settings by selecting Save Alert Settings on the File menu. The next time you want to use alerts you simply double-click the .pma file previously saved. Figure 5 shows the Alert view of PerfMon with two settings and about 10 alert entries.
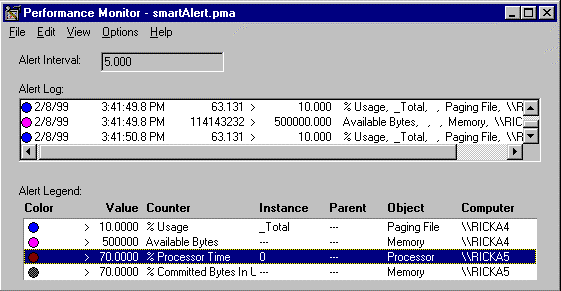
Figure 5. Performance Monitor Alert view
The alert log keeps the last 1,000 log events. Notice the Alert Interval: edit box incorrectly shows 5, even though I've selected a manual update.
While this alert mechanism is interesting and opens many possibilities, its usefulness is limited. PerfMon has a black-and-white, good-and-evil view of the performance data. In the real world it would be nice to have yellow alerts (warning), red alerts (critical problems), perhaps many levels of alerts. To be useful, alerts would have to be run on an interval, not manually updated like I demonstrated. Suppose I go to lunch and all is well on RICKA5 (my shared Windows NT Terminal Server). While I'm away, Joe Disk Hog logs on and downloads all the Dilbert bitmaps for the last month. With the default five-second interval, that amounts to 1,080 network message dialogs I have to dismiss. (12 logs/minute * 60 minutes/hour * 1.5 standard lunch hour). You don't want your event log spammed with essentially the same message repeated thousands of times. Because PerfMon keeps only the last 1,000 events, the log won't contain any other events that occurred before the flood started. All of these limitations would reduce alerts to a mere gimmick, except for the Run Program on Alert option.
By utilizing the ability to run a program on alert, we can write the alert data to a database without repeating messages. A simple viewing application can then read the log without overwhelming us with redundant messages. The basic strategy is outlined here.
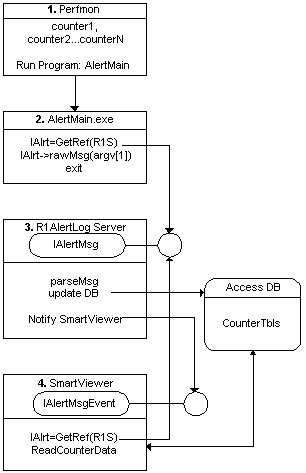
Figure 6. Smart Alert architecture
The Run Program (AlertMain.exe) is a simple console application that gets a reference to a running ATL singleton EXE server (R1AlertLog). It simply forwards the alert message to R1AlertLog and exits. R1AlertLog parses the message and then puts the parsed message fields into a table in the SmartAlert.mdb Access database. R1AlertLog then fires a connection point event to the SmartViewer program, notifying SmartViewer that there is new alert data to read. SmartViewer reads the data and displays it in a table format.
The R1AlertLog server reads the SmartAlert database on creation and stores the existing alerts into memory. Each new alert is cached in memory so the server can quickly determine what data is redundant and what data needs to be updated. If the server was not a singleton, multiple instances of PerfMon could start multiple instances of the server and new updates would get out of sync.
We also want the AlertMain program to be very efficient because it potentially could be called several times per second. Component creation is always expensive; in this case, it's even more expensive because of the large initialization cost that R1AlertLog incurs as it reads the database into memory. By making R1AlertLog a singleton (and keeping it running), the CreateInstance call just returns a reference to the running server. That's much lighter weight than creating and initializing a component. You could keep a regular EXE server running, so the CreateInstance call would simply return a reference to the running server when its ref count was zero, but our architecture allows multiple instances of PerfMon to share the same database. If R1AlertLog were not a singleton, another PerfMon calling CreateInstance would create a new instance of the server. If R1AlertLog is not running, CreateInstance does create one and starts it running.
Most programmers think that if they specify their COM threading model as apartment their server is thread safe. While this is true of regular components, it's not true for singleton DLLs. Two clients referencing a singleton DLL each have the same raw pointer into the DLL. This scenario is exactly like two threads in one process each accessing the same global memory. Because R1AlertLog is an out-of-process (EXE) server, all calls are marshaled to the server and there are no data synchronization problems. See Knowledge Base article (search on ID number Q201321) "HOWTO: Alternative Implementation of ATL Singleton" for more information.
The AlertMain program gets a reference to the R1AlertLog server and uses the PutrawMsg method of the interface to forward the alert message string to the server. (The viewer application also calls CreateInstance on R1AlertLog, so if the viewer is running, AlertMain's CreateInstance call simply returns a reference to the running singleton server.) When the ref count does go to zero (the viewer has exited and AlertMain has exited), ATL servers by default wait for dwTimeOut (5000 milliseconds or 5 seconds) before shutting down. Because my server has a significant overhead on startup, I changed the wait time to 30 minutes by changing dwTimeOut to 1000 * 60 * 90.
The complete listing for AlertMain.cpp follows:
#import "..\\debug\\R1AlertMod.exe" no_namespace
void main(int argc, char* argv[]){
    ::CoInitialize(NULL);
    IAlertMsgPtr spIA;
    HRESULT _hr =spIA.CreateInstance(__uuidof( AlertMsg ));

    spIA->PutrawMsg(_bstr_t(argv[1]));
    ::CoUninitialize();
}
Because AlertMain accepts the alert message on the command line, you don't need to run AlertMain from PerfMon (although you usually will). You could copy an alert message from the event log and use it as an argument to AlertMain from the command line or from Microsoft Developer Studio®. Running AlertMain from DevStudio is handy because you can step into the server and debug it.
The Access database file has three tables, LastCounterDataTbl, FirstCounterDataTbl, and ExtremaCounterDataTbl (which contains the First, Last, and Max/Min alert data). Both the client viewer and the R1AlertLog server component access the database through Microsoft ActiveX® Data Objects (ADO). The first, last, and extrema CounterDataTbl tables have exactly the same schema. I could have added a recordType field (first, last, or extrema) and had one table, but I elected to have a more normalized schema that would make reads by the client more efficient (because the query would not have to specify recordType) and updates more efficient for the server.
Table 1. xxxCounterDataTbl Table Schema (where xxx is Last, First, or Extrema)
| autoIndx | Counter | Object | Computer |
| Val | dateTime | Parent | recordDir |
The autoIndx field is an automatic unique index (primary key) generated for each counter path message stored in the table. Counter, Object, Computer, Val, dateTime, and Parent are the counter, object instance, computer, value, and date from the alert. recordDir is the direction (over or under), which is denoted by > or <, depending on whether we're logging over or under conditions. The first time a new counter fires, three records are stored in the Access database. The first alert is stored in each xxxCounterDataTbl table. Subsequent alerts update the date and value fields of the LastCounterDataTbl table and the date and value fields of the ExtremaCounterDataTbl table when there is a new extrema.
Figure 7 shows the FirstCounterDataTbl table with actual data.

Figure 7. The FirstCounterDataTbl table viewed from Access
The brains behind SmartAlert is the R1AlertLog COM component. When the R1AlertLog server gets a new alert message, it parses the character message and saves the data in the Access database. By only recording the first, last, and extrema, no redundant data is kept.
The AlertMsg simple control was created using the ATL wizard with Support Connection Points checked. With connection points, the R1AlertLog gains the ability to fire events to clients who have registered with the server. Not only can clients like AlertMain call into R1AlertLog with its normal incoming interface, but R1AlertLog can fire events with its outgoing interface. This is how the R1AlertLog server notifies SmartViewer that new data has arrived. Without connection points, the Microsoft Visual Basic® client would have to continually poll the R1AlertLog server or the database for new data. While polling is marginally easier to implement, it wastes resources and is about as hip as a polyester leisure suit.
With Microsoft Visual C++® version 6.0, the ATL wizard makes connection points easy. In Visual C++ 5.0, you had to do many steps manually. The ATL tutorial (MSDN \ Visual C++ Documentation \ Reference \ MFC Library and Templates \ ATL \ ATL Tutorial) does an excellent job of demonstrating how to implement connection points in an object, so we won't go into that here.
The SmartViewer application is a simple Visual Basic client with an ADO connection to the SmartAlert Access database and a connection point sink interface for the R1AlertLog server. The SmartViewer client application launches the R1AlertLog server using CreateInstance and registers the sink. R1AlertLog calls the following event handler in SmartViewer:
Private WithEvents alertEvent As R1ALERTMODLib.AlertMsg
Private Sub alertEvent_Alert()
   ReadAlertData
End Sub

Figure 8. SmarAlertLogViewer with alert data
The SmartAlertLogViewer, shown in Figure 8, displays its default view (all the records from the LastCounterDataTbl table). The default sort is by time. From the Options dialog box you can select the first, last, or extrema table. You can select the alarm level you wish to view. Only alerts more extrema than the alarm level specified will be shown. The list box contains a list of all the counters in alert. A future version may use this to filter counters. The Options dialog box is shown in Figure 9.
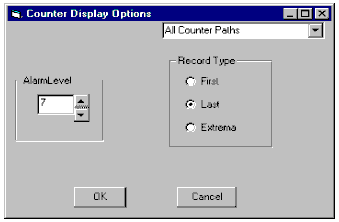
Figure 9. SmartAlertLogViewer Options dialog box
R1AlertLog exposes an incoming interface with one method and two properties, as well as an outgoing interface with two events. I like to design my applications to be easy to test and debug, so I've added methods to R1AlertLog to make it easier to test and debug.
HRESULT rawMsg([in] BSTR newVal); // a read-only property
This is the method used by the AlertMain client to send the alert message string to the server. The About box on the SmartViewer has a text edit box and a Send button so the server can be tested without using PerfMon or AlertMain.
HRESULT clearCntrData();
This method simply deletes all the counter data records in the SmartAlert.mdb database file. It is analogous to Clear Display on the Edit menu of PerfMon.
HRESULT debugMask([in] long newVal);
This property sets an internal member variable in the R1AlertLog server so various portions of the server can be debugged or traced. You can set various debug masks from the About box on the SmartViewer.
HRESULT Alert();
This method is used just to notify the client when new data has been sent to the database and is ready to be read.
HRESULT AlertWithMsg([out] BSTR);
This method is used for debugging. The server can send any debugging string to a client with this method.
The first thing rawMsg does is check to see if the debug message flag has been set. If so, it fires an event to a client with the string a client passed into it. The client calling into rawMsg is not usually the client called back with the message string.
When the server first starts up, it must read all the existing counter data from the SmartAlert database so it knows if a record should be updated or inserted. It uses the local static variable init to test for initialization.
The rawMsg method next parses the string message into all the fields for the table. Once it has parsed the data, it can decide which records to insert or update. After the update, the server calls back into the SmartViewer, notifying it that new data is ready to be read. The rawMsg C++ implementation follows:
STDMETHODIMP CAlertMsg::put_rawMsg(BSTR newVal)
{
    if(m_dbgEnm & dbgMsgE)
        Fire_AlertWithMsg(_bstr_t(newVal));
   static init;
   try{
      if(!init){ init=1;
         readDataFromDB();
      }
      parseAlertData(newVal);
      m_aa.updateDB(m_ad);
      Fire_Alert();   // notify Client of update
    }
catch(char *err){
        Fire_AlertWithMsg(_bstr_t(err));
        return S_FALSE;
    }
     return S_OK;
}
All internal exceptions are caught and their error messages put in an error (char) string. The line number where the exception was caught is appended to the string, and then the error string is thrown. The catch(char *err) block catches the error and sends it to the client with its outgoing interface.
I had the SmartAlerter system working perfectly with a few counters, so I decided to stress test it by adding a dozen more. I was just adding the third new counter when I started getting annoying dialog error messages popping up all over my desk (see Figure 10).
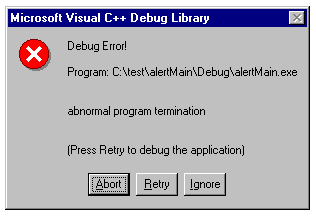
Figure 10. Debug Error dialog box
I enabled debugging from the SmartViewer's About box and the following error came back: "The field 'FirstCounterDataTbl.Instance' can't contain a Null value because the required property for this field is set to True. AlertMsg.cpp line 177." The descriptive error message explained the exact error and even where it occurred. When I design a table schema I always take advantage of data consistency rules, like specifying that a field is required. Most of the CounterDataTbl fields should always be there, but some counters don't have instances. (There is only one memory object on the system, hence no need for instances.) I edited the table schema and removed the required rule and the problem was solved.
Resource monitoring itself uses CPU time, memory, and other resources. To get an idea of the worst-case overhead the SmartAlert system would incur, I started another instance of PerfMon to monitor the SmartAlert components (the R1AlertLog server, SmartViewer.exe, AlertMain.exe, and the PerfMon instance with the four alert counters). I ensured that each of the four alerts fired every five seconds. The R1AlertLog server, not surprisingly, took the most processor time, averaging 1.3 percent of the CPU with a maximum of less than 5.5 percent. None of the other components had a significant impact. In a well set up environment, you shouldn't get 48 alerts per minute. Figure 11 shows the PerfMon chart of the SmartAlert components. Notice that full scale is only 10 percent of the CPU time, so the graph is magnified by a factor of 10. After changing PerfMon's update interval to 15 seconds (yielding 16 alerts per minute), all the SmartAlert components showed 0 percent maximum processor time. While the overhead had not actually dropped to zero, it was certainly insignificant.
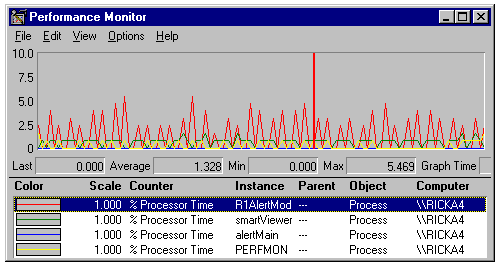
Figure 11. PerfMon chart showing overhead of SmartAlert system (magnified by 10)
PerfMon alerts are easy to set up and important to maintaining a healthy system. With just a bit of coding, I've created a useful ATL component that makes alerts even easier to monitor. By separating the data from the application, we no longer have a limited monolithic application (PerfMon). With the addition of alarm levels, the client can be programmed to respond differently to critical events than it does to less dangerous alerts. If the server free disk space drops to less than 100 MB that would trigger a level 0 alarm, just logged with no further action. Dropping to 75 MB (a level 1 alarm) would send e-mail to the system administrator and their backup (still logging the alert). Once the free space drops to less than 50 MB (level 2), the sys admin would be paged. Just to make sure there is response by level 2, a level 3 alarm could automatically issue you a pink slip.
Because PerfMon is not limited to the local machine, you can protect all of your mission-critical elements from one location. You could monitor the "Max Temp DB Space Used" on each of your SQL Servers™, the "Anonymous Users/sec" on your Web server, or even your own custom performance data. (See "Instrumenting Windows NT Applications with Performance Monitor" in the MSDN Library Online or CD, and Jeffrey Richter's "Custom Performance Monitoring for Your Windows NT Applications" at www.microsoft.com/msj/backissuestop.htm.) While monitoring all your critical remote objects from one local PerfMon instance would be ideal, PerfMon cannot do this reliably. If any one of the remote computers being monitored loses its network connection with PerfMon, PerfMon will hang until the connection is reestablished. PerfMon won't notify the Run Program you specified or the application event log. You will eventually get the following message in the PerfMon log: ".... Computer Not Responding ... \\CNR," where CNR is the computer that is not responding.
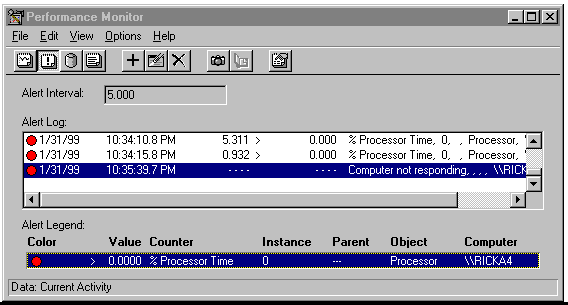
Figure 12. PerfMon Chart view with "Computer not responding" message
You can get around this problem by creating a .pma file for all computers you monitor. Because the R1AlertLog is a singleton, there is no problem with multiple programs calling into it. Now if computer XYZ loses its network connection, it won't stall the rest of the counters. But now you have a different problem: How can you tell if PerfMon is stalled? One approach would be to initialize R1AlertLog with a list of each computer you want to monitor. The server could then periodically ping each computer to verify the network connection. The ping approach will work while I implement my own version of PerfMon charts (which will be more integrated and won't have the same network connection problems).
My Knowledge Base article (search on ID number Q215495), "SAMPLE: SmartAlerter Extends PerfMons Alert Mechanism," contains the complete code listing for the SmartAlerter system.
You can use the Comment box on that page to add suggestions, make corrections, or ask questions.
The SmartAlerter sample shows the clear advantage COM has for building a multicomponent system. We have taken an existing application (PerfMon), written the performance-critical elements in C++ (for the highest efficiency, flexibility, and low-level control), and used Visual Basic to rapidly create a GUI application for data presentation. The result is an easily extensible and actually useful system, not just a "Hello World" demo. Even with all the components from debug builds, the CPU and memory footprint are insignificant. The entire prototype took about a day to get working. It would take much longer to develop an equivalent system if you were limited to just one language.
When it comes to low-level system programming (like the R1PHDmod component) and code efficiency, there is no substitute for C++. For rapid GUI development, Visual Basic dominates. For Web development, you need HTML and a scripting language. COM lets you build systems by taking advantage of each language's strengths.
Windows NT's powerful built-in performance data functionality can be used to solve many computing problems, including providing early warning about resource usage problems that could, if ignored, cause a system crash. In this article I have shown how PerfMon can be used to send notification that a critical resource needs attention. Although PerfMon's built-in notification mechanism can be utilized to monitor system resources, I have introduced a more flexible and powerful system to make sense of PerfMon alert messages.