Query Designer Layout
See Also
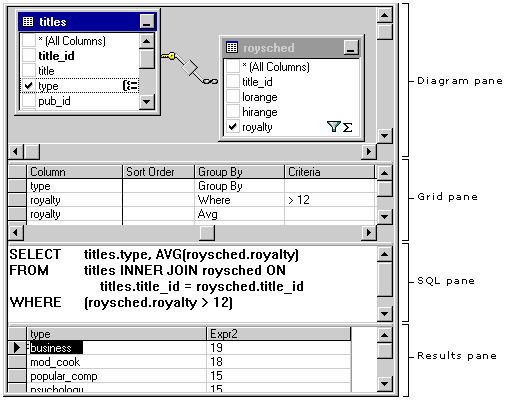
The Query Designer consists of four panes: the Diagram pane, the Grid pane, the SQL pane, and the Results pane.

-
The Diagram pane displays the input sources (tables or views) which you are querying. Each window represents an input source and shows the available data columns as well as icons that indicate how each column is used in the query. Joins are indicated by lines between the input source windows. For more information, see Diagram Pane.
-
The Grid pane contains a spreadsheet-like grid in which you specify query options, such as which data columns to display, what rows to select, how to group rows, and so on. For more information, see Grid Pane.
-
The SQL pane displays the SQL statement for the current query. You can edit the SQL statement created by the Query Designer or you can enter your own SQL statement. It is particularly useful for entering SQL statements that cannot be created using the Diagram and Grid panes, such as Union queries. For more information, see SQL Pane.
-
The Results pane shows a grid with the results of the most recently executed Select query. You can modify the database by editing values in the cells of the grid, and you can add or delete rows. For more information, see Results Pane.
You can create a query by working in all of the panes: you can specify a column to display by choosing it in the Diagram pane, entering it into the Grid pane, or making it part of the SQL statement in the SQL pane. The Diagram, Grid, and SQL panes are synchronized — when you make a change in one pane, the Query Designer updates the other panes to reflect the change.

