Visual InterDev
The Script Debugging Process
See Also Tasks
You can use the Microsoft® Visual InterDev™ debugger to test scripts written in Microsoft Visual Basic®, Scripting Edition (VBScript) and Microsoft JScript™. Debugging Web pages can be different than debugging in traditional development environments in these ways:
-
Most Web applications consist of scripts that run on the client (in .htm files) and on the server (in .asp files, the Global.asa file, and .cdf files).
-
Scripts can be in different languages.
-
Scripts can be mixed with HTML text.
-
Many Web applications include not just scripts, but Java components such as applets and COM objects.
The Visual InterDev debugger allows you to debug in all of these scenarios. You can debug client script running in your local version of Microsoft® Internet Explorer.
Note It is highly recommended that you do not use Active Desktop™ mode of Microsoft Internet Explorer 4.0 when you are debugging.
To debug script running in Microsoft® Internet Information Server (IIS) 4.0, you can run the debugger on your computer and attach it to a script running on the server. If the server is running on another computer, you can use remote debugging to debug script running there.
Note For information about debugging Java components on your Web page, see the Java documentation on debugging.
Types of Errors
Debugging is about finding errors. When you work with script, you might encounter the following types of errors that require debugging:
-
A syntax error occurs if you mistype a keyword, forget to close a multiline command (such as DO … LOOP), or introduce a similar syntax error. If a script includes a syntax error, the script will not execute and an error message is displayed as soon as the browser or server processes the page.
Note In some programming environments, syntax errors are referred to as preprocessor, compilation, or compile-time errors.
-
A run-time error occurs when a command attempts to perform an action that is invalid. For example, a run-time error occurs if you try to perform a calculation using a variable that has not been initialized. If a run-time error occurs, the script either stops or performs an exception routine.
-
A logic error occurs when a script executes without syntax or run-time errors, but the results are not what you intended. For example, a script might prompt the user for a password, but then allows access to the application even if the password is wrong.
Working in the Debugger
The basic process of debugging scripts consists of these tasks:
-
Start debugging by running the document you are currently working with in your Web project, or by attaching the debugger to a document that is already running in a browser or on a server. You can also launch the debugger in response to a script error, which is called just-in-time debugging.
-
Stop script execution by issuing a break command. You can also set a breakpoint in the script where the debugger will stop automatically. When you stop a procedure, its source is displayed.
-
Inspect the state of the script by examining the values of variables or properties and the list of running procedures (the call stack).
-
Control the execution of individual statements or procedures (stepping) and watch the effect both in your application and by watching the values of variables or properties.
-
Skip over (step over) or walk through (step into) procedures called by the current procedure. If multiple procedures or threads are active, you can move to another one and proceed from there.
Note You can't work with the debugger in Design view or Quick view of the HTML editor. To debug, switch to Source view.
To allow you to perform these tasks, the debugger includes these commands and windows:
-
The Processes dialog box allows you to attach the debugger to a document that is already running in a browser or on a server, which can include scripts in pages that are not part of your Visual InterDev project. You can debug scripts running locally on your computer or attach to processes running on remote computers, such as an .asp file running on a server.
-
The Running Documents window allows you to view a list of documents that are available to the debugger.
-
Source view in the HTML editor displays source code of the script or component you are debugging. If the script or component you are debugging is part of your current Visual InterDev project, you can fix errors, and then rerun the document to test it again.
-
In the Visual InterDev HTML editor, you can set and clear breakpoints. After the debugger has reached a breakpoint, you can use commands on the Debug menu to step into individual lines in your script. If you reach a point in your script that calls another procedure (a function, subroutine, or applet) you enter (step into) the procedure or run (step over) it and stop at the next line. At any point, you can jump to the end (step out) of the current procedure and proceed to the next breakpoint.
-
In the Locals window you can see the values of variables within the scope of the current procedure. You can also specify that you want the debugger to display the values of specific expressions, such as properties, by setting up watch expressions in the Watch window.
-
To set and change values, you use the Immediate window. You can evaluate any expression in the window and can enter script commands and see their effect. You can also view and change values in the Watch window.
-
Using the Call Stack window, you can move to any currently active procedure.
Understanding Script Processing
Understanding how client scripts are processed and how errors are handled can help you debug client scripts successfully.
Processing Client Script
Client script is processed by Microsoft Internet Explorer. The browser calls the appropriate run-time module to process VBScript scripts or JavaScript scripts.
Client scripts are initially parsed when the Web document is loaded into the browser. During this parsing phase, the browser reports any syntax errors that it finds.
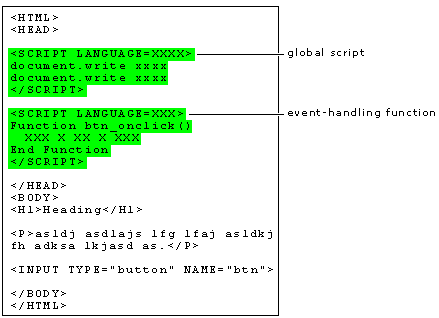
After parsing a section of script, the browser executes it. Global or inline scripts, which are scripts that are not part of an event-handling subroutine or function, are executed immediately. Event-handling subroutines or functions, and procedures that are called by other procedures, are parsed immediately but are not executed until triggered by an event or called by another procedure.
Client script processing

If a run-time error occurs when a client script is executed, an error message is displayed and the script containing the error stops. Other client scripts in the document can still run (unless you start the debugger). If the script containing the error is called again, the error message is displayed again.
Depending on the language you are using, you might be able to include statements in your scripts to trap run-time errors and run your own error procedures. For example, in VBScript, you can use the ON ERROR statement to establish error trapping. For more details, see the documentation for your scripting language.
Processing Server Script
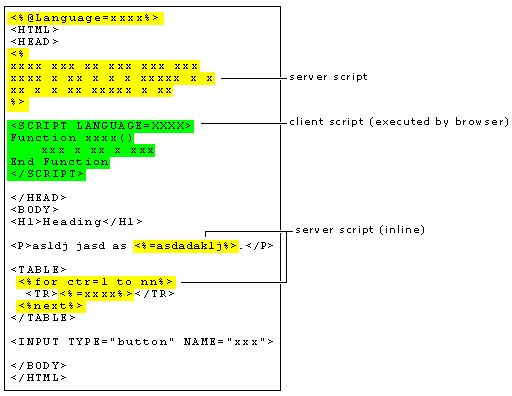
Most server script is not event-driven. Instead, when an .asp file is requested, the server reads the page and processes all server script from top to bottom. This includes script that is inline with HTML text, as shown in the following diagram.
Server script processing

Not all server script is executed immediately. As with client script, server script can include functions and subroutines that are executed only when they are called from other procedures.
Global.asa files are a special case. The Application_OnStart and Session_OnStart procedures in these files are executed only once for an application and for a session. Therefore, to debug these events easily, you must embed debugging statements in the file. For details, see Debugging a Global.asa File.
