Running a Simple APE Test
The basic steps to use Application Performance Explorer are:
-
Selecting a profile.
-
Configuring the component objects.
-
Running and evaluating the test results.
Selecting a Profile
With Application Performance Explorer you can define a variety of parameters to determine their overall impact on your application's performance. Each of the profiles uses the same set of component object types, with user settings to control various aspects of their functionality.
APE profiles are divided into two categories: asynchronous and synchronous. Each profile contains preconfigured settings for each of the component characteristics, quantities, connection options, workers, services, and clients. All of these settings collectively form the profile of the application design scenario to be modeled. You can also create your own profile by selecting an existing profile, individually configuring the component services, and then saving the profile with a custom name.
Configuring the Component Objects
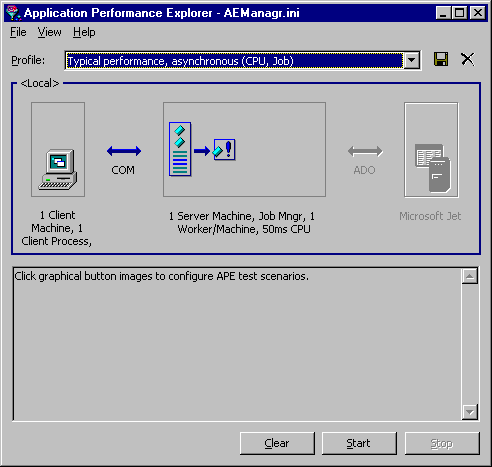
You configure each type of object by clicking any of the five large buttons on the APE Manager user interface.
The buttons display dialog boxes that specify the number of objects to be created, data passing options, timing requirements, callback options, logging options, and other variations in the construction and use of the objects. Configuring the component objects provides great flexibility for modeling your enterprise application. You can even specify your own component service objects.
Running and Evaluating the Test Results
Once the test configuration is complete, you click Start to run the APE test. As the test runs, certain test events such as creating the clients and service objects appear in the results window. When the test is complete, you can view the overall test performance in the results window. As you become familiar with how Application Performance Explorer works and what it can do, you might want to store the detailed test information by configuring the log file to save selected test events.
Running a Simple APE Test
In the procedure below, you will select a typical APE profile, make a few simple modifications, run a performance test, and examine the output.
To run a simple APE test
-
From the Start menu, click Programs, point to Microsoft Visual Studio 6.0, Enterprise Features, and then click Application Performance Explorer.
The main Application Performance Explorer window appears.

-
From the Profile list, select a profile. For this test run, select "Typical performance, asynchronous (CPU, Job)."
-
Click the large Client Process button.
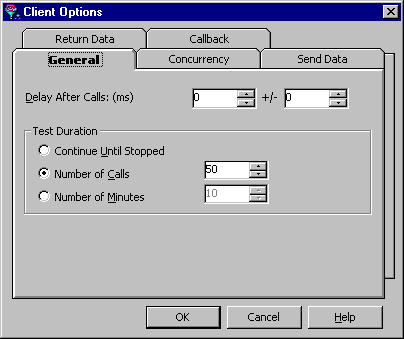
The Client Options dialog box appears.

-
On the General tab, set the Number of Calls to 50.
This shortens the duration of the test to the time it takes to make 50 client calls (instead of the default 100 calls).
-
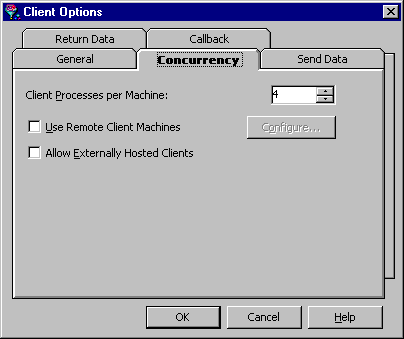
Click the Concurrency tab.

-
On the Concurrency tab, set the Client Processes per Machine to 4.
This causes the test to allocate four concurrent client processes on the single APE Manager machine. More than one client process is realistic, since a user might be expected to simultaneously run at least four applications (such as your enterprise application, word processing, scheduling, and e-mail).
-
Click the Start button to begin the test.
-
Wait for the test to finish or click the Stop button.
-
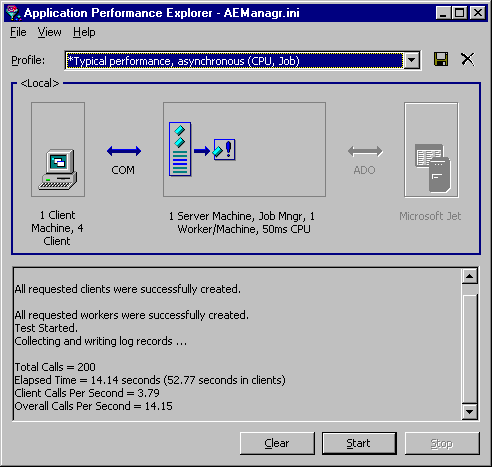
View the test results in the results pane at the bottom of the screen.

The results window shows that all requested clients were successfully created for a test run total of 200 calls (50 calls for each of four client processes). The Elapsed Time, Client Calls Per Second, and Overall Calls Per Second are also indicated.
-
Click Clear to clear the results window.
