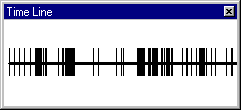
Use the Timeline view to see a graphical representation of how long it took to run an application. In the Timeline view, Visual Studio Analyzer events are displayed as tick marks along a timeline. You can select one or more events in the Timeline view and see those same events highlighted in the Event List or Chart views.
The following picture shows what the Timeline view looks like.

Sizes the timeline display so that all of it fits within the view.
Adjusts the amount of data shown in the Timeline view so that a greater or lesser time range is shown.