Monitoring and Tuning Your Server |
Once you have created a script and configured all the settings, users, and clients, you can start the test. Select Sample Script and choose Run from the Scripts menu. Allow the test to complete.
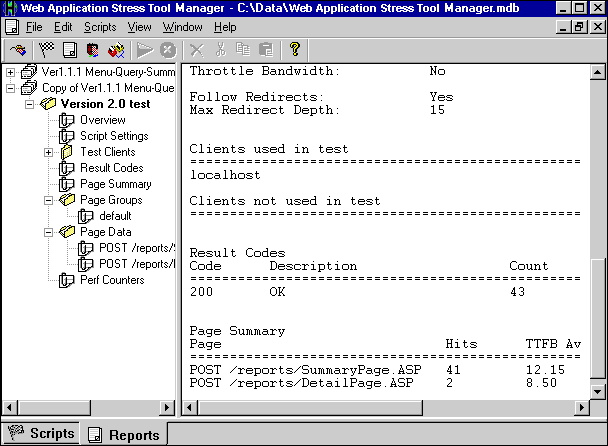
To open the Reports view, shown in the figure below, choose Reports on the View menu. Expand the Sample Script report to display all of the report nodes. There should be at least one node with a title that marks the date and time when your most recent test began. To view a summary of that test, expand and select the top level of this report node.

You can select a specific node of the report tree to view more in-depth information. For example, select the Result Codes node to display a sum of the HTTP result codes for every request in the test. Expanding the Perf Counters node displays the counters that have been collected during the test.
Expand the Page Data node and select the first script item. The pane on the right displays detailed information regarding this script item. The page data section of the report provides the response time for each requested page. This period of time, also known as Time To Last Byte (TTLB), is a good source of performance data.
Time To First Byte (TTFB) is the time from the request for the page until the Web Application Stress Tool receives the first byte of data, in milliseconds. TTLB is the total time from the request until the last byte of data has been received on the client, also in milliseconds. This number includes the TTFB time and any additional time needed to receive all of the data for the page. The requests are sorted, and the data is divided into percentiles. For more information about the p-squared algorithm and percentiles, see the Web Application Stress Tool Knowledge Base article at http://webtool.rte.microsoft.com/kb/hkb30.htm.
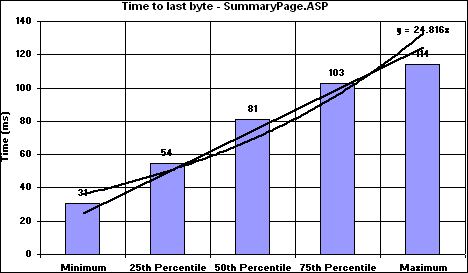
In the Report view, you can select Export to CSV from the File menu. Exporting the report values to a format that Microsoft® Excel can read allows you to create charts that show where most of the requests fall. For example, the Excel chart shown in the following figure illustrates this in a Time To Last Byte report.
