Monitoring and Tuning Your Server |
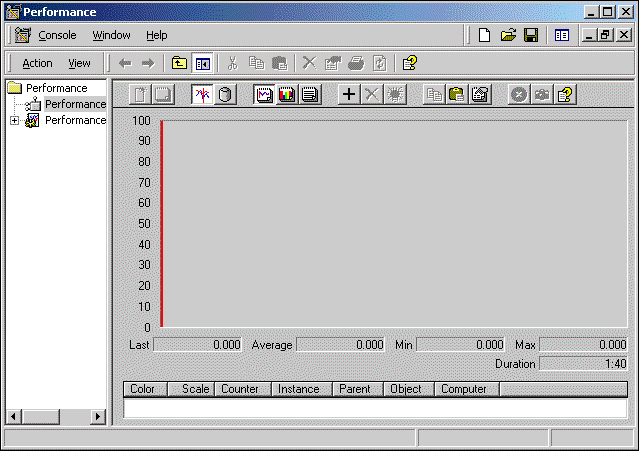
The System Monitor, commonly referred to as PerfMon (Perfmon.msc), is a snap-in control for MMC. It reads software counters that are built into both IIS 5.0 and Windows 2000 Server. It also lets you log counter activity and set alerts. PerfMon is indispensable for watching your server. The startup PerfMon display is shown in the following figure.

Software performance counters are built into IIS 5.0 and the Windows 2000 operating system. Developers can also build them into custom ISAPI DLLs. These counters are frequently misrepresented as being “PerfMon Counters,” but in fact they are built into IIS 5.0 and the operating system, not into PerfMon. These performance counters can be read directly by many applications, including PerfMon, the Web Application Stress Tool, and WCAT. PerfMon provides a handy user interface to performance counters, for the purposes of monitoring and logging.
Each performance counter is named by the object it collects data from (for example, the processor) and by the data it collects (for example, in the PhysicalDisk performance object, Current Disk Queue Length). The object and the specific counter name are separated by a backslash (\). If more than one instance of a particular counter exists, the instance name is separated from the counter name by a colon, and if more than one object or instance of a particular type exists (for example, if your server has more than one processor chip), a hash mark or number sign (#) and a number (the count of the specific object, starting at 0) are presented at the end of the counter or instance name (for example, Process\ % User Time: explorer#0). For some counters, “<No Instances>” is shown in grayed-out text in the list of instances, if there is no current instance.
For a description of a particular counter, click the + button in PerfMon, then select the counter you’re interested in, and click the Explain button. Note that many of the IIS 5.0 counters display the last observed value or a cumulative count, not an average value or rate.
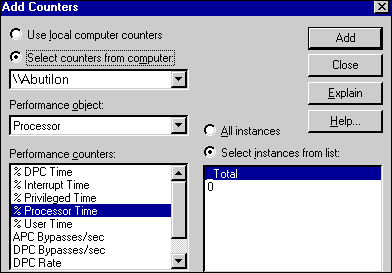
Different counters provide different kinds of information, at varying levels of granularity, so it’s important to know which counters to watch. For example, there are both logical and physical Disk counters; the counters of the Processor object are replicated for each processor in the system, and so on. To choose a specific instance of a counter, use the list of instances on the right-hand side of the Add Counters dialog box, as shown in the figure below. To reach this dialog box, click the + button in the toolbar on the right-hand side of the PerfMon console.

PerfMon is not limited to the computer on which it is installed. Use the Select counters from computer field in the Add Counters dialog box to choose a different computer to read from. This is especially helpful when you don’t want to add any more overhead to the operation of your server than is absolutely necessary. Remember that the service you want to monitor on the other computer must be running in order for its counters to be exposed. If the service is not running, you need to quit PerfMon, start the service, and run PerfMon again.