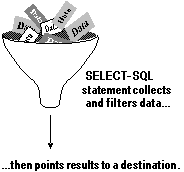
Once you create tables and forms for your application, you can add queries and reports to select and display data for your users. Your queries can be directed to a variety of destinations so that you can use them in the other components of your application. You can also run reports separately without using a query. This chapter highlights some of the ways you can use queries, add reports, and expose queries and reports to the user.
When you use a query or a view in your application, you are actually using a SELECT - SQL statement. This chapter describes how you can use a SELECT - SQL statement in your application whether you create it through a query defined in the Query Designer, a view defined in the View Designer, or code entered for an event or procedure. For detailed information about views, see Part 2, Finding Information, in the Userís Guide.
This chapter discusses:
When you add queries to your application, you can combine a variety of data sources, finely filter records, manipulate data, and sort the results ó all with the SELECT - SQL statement. By using the SQL statement, you have complete control over the results your query produces and where the results are stored.
A query is a SELECT - SQL statement.

You can add SELECT - SQL statements to procedures or to event code. For more information about events, see Chapter 4, Understanding the Event Model.
To create a SELECT - SQL statement
-or-
For example, you can select all the records from the Customer table in the TasTrade database where the country field contains the value ďCanadaĒ:
SELECT * ;
   FROM tastrade!customer ;
   WHERE customer.country = "Canada"
To execute the command immediately, you can enter the statement in the Command window. If you want each clause to appear on a separate line within the window, end each line except the last one with a semicolon so that Visual FoxPro processes the command only after the last line.
If you only need a certain number or percentage of records from the result set that your query would return, you can use the Top property on the Miscellaneous tab in the Query or View Designers or you can add a TOP clause to your SELECT - SQL statement. The number you provide in a TOP clause can range from 1 to 32,767. For a percentage, you can use from 0.001 to 99.99.
For example, if you want to select the top 10 customers with the highest order amounts, you can specify a GROUP BY on CUST_ID to show one aggregate record for each customer and sort by ORDER_AMT in the ORDER BY clause. To get a true TOP 10, you need to specify a descending sort on the ORDER_AMT so that the records with the highest order amounts appear first in the results. If you use an ascending sort, the result records are ordered from the least order amount to the most. The top records you select from the result set would actually have the lowest values.
SELECT TOP 10 *;
FROM testdata!customer INNER JOIN testdata!orders ;
ON Customer.cust_id = Orders.cust_id;
GROUP BY Customer.cust_id;
ORDER BY Orders.order_amt DESC
By using clauses of the SELECT - SQL statement, you can specify several destinations to store your query results.
| To send results to this destination | Use this clause |
| Separate table | INTO TABLE mytable |
| Array | INTO ARRAY aMyArray |
| Temporary table | INTO CURSOR mycursor |
| Active window | TO SCREEN |
| Browse window | The default if no other destination is specified. |
Once the results are stored, you can use commands to control how the stored results are integrated for display or printing.
You can store your query results in a table, array, or cursor for other uses such as populating forms and printing reports and labels. If you want to store the results only temporarily, send the results to an array or cursor. If you want to store the results permanently, send the results to a table.
To specify a table as the destination
The following example shows an INTO clause for a table:
SELECT * ;
   FROM tastrade!customer ;
   WHERE customer.country = "Canada" ;
   INTO TABLE mytable
To specify an array as the destination
The following example shows an INTO clause for an array:
SELECT * ;
   FROM tastrade!customer ;
   WHERE customer.country = "Canada" ;
   INTO ARRAY aMyArray
To specify a cursor as the destination
The following example shows an INTO clause for a cursor named mycursor:
SELECT * ;
   FROM tastrade!customer ;
   WHERE customer.country = "Canada" ;
   INTO CURSOR mycursor
If you create a table or an array, you can use it like any other table or array in Visual FoxPro. If you create a cursor, you can browse through its contents. The cursor is opened in the lowest available work area. You can access it by using the name you gave it in the SELECT - SQL statement.
The following two procedures describe two common ways to include query results stored in tables and cursors into an application.
If you want to display your query results in a form, you can use a table, array, or cursor to populate a grid, list box, or combo box.
To populate a list box or combo box control with a table or cursor
To populate a grid control with a table or cursor
If your report or label includes groups or you otherwise need to order the data, you can use the various clauses of the SELECT - SQL statement to get the exact results you need.
To send results to an existing report or label
The following example uses the GROUP BY and ORDER BY clauses as well as the REPORT FORM command:
SELECT * ;
FROM tastrade!customer ;
WHERE customer.country = "Canada" ;
GROUP BY customer.region ;
ORDER BY customer.postal_code, customer.company_name ;
INTO CURSOR MyCursor
REPORT FORM MYREPORT.FRX
The following example uses a LABEL FORM command:
SELECT * ;
FROM tastrade!customer ;
WHERE customer.country = "Canada" ;
GROUP BY customer.region ;
ORDER BY customer.postal_code, customer.company_name ;
INTO CURSOR mycursor
LABEL FORM MYLABEL.LBX
While the SELECT - SQL statement is the most flexible method for populating your report or label, it is not the only method. For more information about setting report data sources, see the section Controlling Data Sources later in this chapter. For more information about integrating the report destinations into your application, see Integrating Queries and Reports later in this chapter.
If you want to display the results of your SELECT - SQL statement, you can send the results to a window. The Browse window is the default destination for query results and you don't need to include a destination clause. You can also send the results to the main Visual FoxPro window or another active window.
To display results in the main Visual FoxPro window
To display results in another active window
This code example shows the definition for a temporary window titled ďTop CustomersĒ that displays the names of companies with more than $5,000 in total orders for the year.
Displaying query results in a window
| Code | Comment |
|
Create and start a temporary window object. |
|
Enter a SELECT - SQL statement. |
After you collect and organize your data, you can add reports or labels to your application to print the data or display it on the screen. You can control the data in your report through the data sources you choose, and manipulate and combine raw data with report variables. Report variables store values that are calculated and used in a report.
To control the data sources for a report, you can define a data environment that is stored with the report or you can activate specific data sources in code each time you run a report. For more information about using the Data Environment Designer, see Chapter 9, Creating Forms.
| To | Add |
| Always use the same data sources. | Tables or views to the reportís data environment. |
| DO query or SELECT - SQL to the Init event of the reportís data environment. | |
| Use separate sets of data sources. | USE table, USE view, DO query, or SELECT - SQL to the Click event or other code that precedes a REPORT or LABEL command. |
If you use a table as the data source, use aliases on the fields in the report only if you don't plan to use the report with any other data source than the table itself. If you use a view or query as the data source and aliases are included in the report controls, the report might display the same record repeatedly on the report page.
You can use the data sources used by the report to control the order the records print in your report. The records are processed and printed in the order they appear in the table, view, or query. To order the records in a table, you can set an index in code or as part of the report's data environment. For a query, view, or SELECT Ė SQL code, you can use the ORDER BY clause. If you don't order the records using the data sources, the only way to use just the report to order the records is through the ORDER property on a cursor in the data environment.
In addition to the order records appear in the report, you can select which records are printed by using the data source, the report printing options, or a combination of both.
| To use | Add |
| View or query | Conditions in the Filter tab |
| SELECT - SQL | WHERE or HAVING clause |
| Report Designer | Setting in the Print Options dialog box |
| REPORT command | Scope, FOR, or WHILE expressions |
| Table | Filtered index |
To prevent your report's data session from being affected by the global data session as a result of changes made in other designers, you can set the report's data session to Private.
To set a private data session
For more information about using the Data Environment Designer, see Chapter 9, Creating Forms. For more information about data sessions, see Chapter 17, Programming for Shared Access.
If you want to display your query results in a graph, you can use the Graph Wizard, the Query Designer, or a SELECT - SQL command. To use the Query Designer or a SELECT - SQL command, follow the steps below. You need to include at least one numeric field in your result set to create a graph. After completing the query, you can select one of six types of graphs, each with two variations.
To modify the graph
You can refine the layout of your report pages by defining multiple columns and changing the area of the page reserved for a band by changing the height of each band.
To create phone directories, mailing labels, or other types of listings, you can define multiple columns per page.
To define a multi-column report
Page Setup dialog box with columns defined
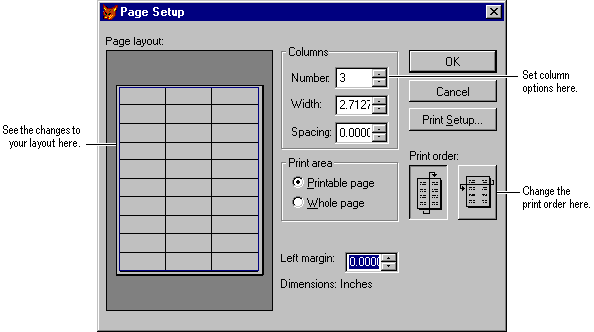
Tip If you're printing groups set to start on a new page, don't use the Print Order option.
The Report Designer reflects your changes.
If your layout already contained report controls in the Detail band, you may need to move or resize them to fit within the boundaries of the new column.
While designing your report, you can change the height of a report band. The height of a report band determines the amount of space that each report band uses on the page within the page margins. For example, if the Title band is set at a half inch, the Title will appear in the first half inch of space after the top margin. The detail band shows the amount of space devoted to each printed record. The following information applies to all of the report bands. You can set additional parameters for Group Header and Footer bands. For more information about Group bands, see the section ďGrouping Data on Your LayoutĒ in Chapter 7, Designing Reports and Labels, in the Userís Guide.
To set a precise band height
A dialog box for the band appears.
You can include field controls in your report or label to display values from a variety of expressions, including fields from tables and views, variables, and calculations. The following sections describe some commonly used expressions and functions such as multiple fields, dates, and page numbers.
You can add field controls in several ways.
To add table fields from the data environment
To add table fields from the toolbar
The table name and field name appear in the Expression for Field on Report box.
Note If the Fields box is empty, add a table or view to the data environment.
You don't have to keep the table name alias in the expression. You can delete it or you can clear the Expression Builder options.
After entering the expression, you can change the format or set printing, position, or stretch options. For more information, see ďAdding a Comment to a ControlĒ in Chapter 7, Designing Reports and Labels, in the Userís Guide, and see Setting a Controlís Print Options later in this chapter.
After you add your table fields, you might notice that they don't print the way you would like on the page. For example, printing the field controls for City, Region, and Postal Code separately produces unwanted spaces between each value. You can trim or concatenate the table fields into one field expression. The space required by each value for this control will vary. You can set the control to adjust for each value.
To combine several table fields into an expression
Tip Size the field to the least amount of room the expression will require. If more space is needed, you can set the control to stretch for larger values, but you canít set it to shrink if less space is needed.
The string function appears in the Expression box with expC selected.
The field name replaces the expC.
When the control is populated, the space allocated to the control adjusts downward to accommodate the value of the expression. For more information about Stretch with Overflow, see Printing Controls with Variable-Length Values later in this chapter.
To combine several fields in an expression, place an ALLTRIM( ) function before each field name, place punctuation inside quotation marks, and place a plus sign between each of the elements in the expression. If the field value lengths don't vary, such as with postal codes or abbreviations, you can insert just the field name, as in this example:
ALLTRIM(city)+", "+region+" "+postal_code
Notice the spaces in quotes, rather than a comma, to separate the region and the postal code.
For more examples, see the report Invoice.frx in the Visual Studio Ö\Sample\Vfp98\Solution\Reports directory.
To quickly trim and concatenate character expressions in the Expression Builder, you can place commas between character expressions. The value of the expression preceding the comma is trimmed. You can also use semicolons to place the expression on a new line, provided that the trimmed value has a length greater than zero. The following example shows character expressions for fields in a mailing address:
contact_name; address; city, region, postal_code
Note Use these when you don't want to include punctuation in the value.
If you use these methods, make sure the field is set to Stretch with Overflow. For more information, see Printing Controls with Variable-Length Values later in this chapter.
You can insert a field control that prints the current date.
To insert the current date
The Page Header or Footer bands usually contain a page number. If you use a wizard or Quick Report, a page number is inserted for you into the Page Footer band.
To insert a page number

Tip You can use this procedure to insert any of the system variables from the Variables list into your report.
To manipulate data and display calculated results in a report, you can use report variables. Using report variables, you can calculate values and then use those values to calculate subsequent values.
To define a report variable
You can use the variable in any expression you enter in the report.
To count all the Canadian entries in the Company table, use this expression and select Count as the calculation option.
IIF(country="Canada",1,0)
The following example shows three variables for a simple time sheet:
| To store this value | Create this variable | Using this expression |
| Time employee arrived | |
|
| Time employee left | |
|
| Total time employee was present | |
|
You can use the tDayTotal variable in a variety of other calculations, such as the number of hours worked in a week, a month, or a year; the average number of hours worked each day; and so on.
For examples of report variables, see the reports Percent.frx and Invoice.frx in the Visual Studio Ö\Samples\Vfp98\Solution\Reports directory.
Report variables are evaluated in the order that they appear in the list and can affect the value of expressions that use them. For example, if variable 1 is used to define the value of variable 2, variable 1 must appear before variable 2. In the previous time sheet example, tArrive and tLeave must precede tDayTotal.
To change the order of report variables
If you use a variable in calculations, be sure that you initialize the variable with a non-zero value to avoid a division-by-zero error. If you don't specify a value, Visual FoxPro assigns a default value of 0.
To set a variable's initial value
If you reorder the groups in your report, your report variables might not be resetting on the correct field. For example, if your report has two groups, the first grouping by country and the second grouping by date, and you switch the order of the groups, the variables still reset according to the original positions of the groups.
You can change the value of a calculation by specifying when the variable is reset. By default, Visual FoxPro resets the report variables at the end of the report.
To reset a variable at the end of a report, a page, or a column
To reset a variable on entry or exit of any band
After inserting a field control, you can change the controlís data type and print format. Data types can be Character, Numeric, or Date. Each of these data types has its own format options, including the option to create your own format template. The format determines how the field is displayed when the report or label is printed.
You can enter format functions directly in the Expressions box of the Report Expression dialog box or you can select options from the Format dialog box.
Typically, you might convert all alphabetical output to uppercase, insert commas or decimal points in numeric output, display numeric output in currency format, or convert one date format to another.
For field controls, you can set a variety of format options for each data type.
To format a field control
The Editing options area displays the formatting options available for that data type.
Note This data type applies only to the report control. It reflects the data type of the expression and doesn't change the data type of the field in the table.
The Format dialog box displays different options depending on the data type you choose. You can also create a format template by entering characters in the Format box.
You can justify field contents within the control in two ways. This setting does not change the position of the control on the report, only the contents within the space of the control.
To justify text in a field control
To justify text in a field
Format dialog box for a Numeric expression
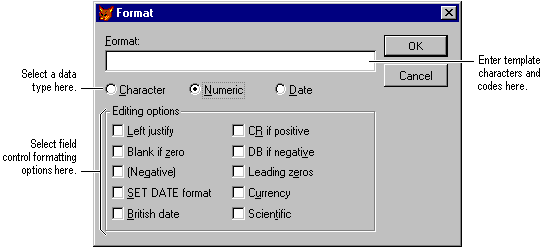
A format template allows you to customize the format of the field. By entering a combination of characters and codes in the Format box of the Report Expression dialog box or the Format dialog box, you can create a wide variety of print formats. The characters you enter appear as literal text along with the field value. The codes you enter determine the appearance of the field output. For example, if you use the following format template for a 10 -digit numeric field, the characters (parentheses, spaces, and dashes) are printed along with the numeric data.
| Format Template | Printed Output |
| (999) 999-9999 | (123) 456-7890 |
You can change the font and size of text for each field or label control or you can change the default font for the report.
To change fonts and size in a report
The Font dialog box appears.
To change the default font
Only the controls inserted after you changed the default font will reflect the new font settings. To change existing objects, select them all, and then change the font using the Font option on the Format menu.
The picture or OLE object you inserted might not fit the frame you drew when you created the control. By default, the picture or object retains its original size. You can clip or scale it to fit into your frame.
If the picture or OLE object is bigger than the frame you created in the Report Designer, only a portion of the picture or object appears in the frame. The picture or object is anchored at the top and at the left of the frame. You cannot see the lower right portion that extends beyond the frame.
To fit a picture in the frame
The whole picture appears, filling as much of the frame as possible while retaining its relative proportions. This protects your picture from vertical or horizontal distortion.
To fill the frame with the picture
The whole picture changes to fill the frame that you sized. If necessary, the picture is stretched vertically or horizontally to fit the frame.
To see an example of a report with pictures, see the report Wrapping.frx in the Visual Studio Ö\Sample\Vfp98\Solution directory.
The OLE objects included in a General field can vary in shape and size. If the object in a General field is smaller than the frame, it appears in the upper left corner of the frame. You can center it to ensure that all objects smaller than the frame are centered in the frame in the report or label. File pictures don't need to be centered because they don't vary.
To center General field OLE objects
The printed OLE objects are centered within the area when the report is previewed or printed.
You can change the color of a field, label, line, or rectangle.
To change colors
You can use the Save As HTML option on the File menu when you're creating a report to save the contents of a form as an HTML (Hypertext Markup Language) file.
To save a report as HTML
The general layout and band position of your controls determine the time and place they are printed. You can also set specific print options for each control. Each control has a default size based either on its value (fields and labels) or the size you created (lines, rectangles, and pictures). The length of the control on the layout defines the display width of the control. Because the value of some controls will vary from record to record, you can set the height of the control to stretch downward to display the entire value. If you don't set it to stretch, the value will be truncated within the display width. You cannot resize Label controls, but you can resize all other controls.
If you want a control to use only the space needed by its value, you can set it to stretch. For example, the values in an expression can vary from record to record. Rather than allot a fixed amount of space on the report that accommodates the longest value, you can set the control to stretch downward to display the entire value. You can set controls below the stretching control to float down the page relative to the stretching control.
Examples of controls set to stretch and float
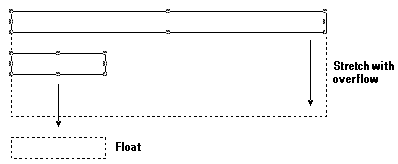
The stretch option is available for fields, vertical lines, rectangles, and rounded rectangles.
For an example of controls that stretch and float, see the report Wrapping.frx in the Visual Studio Ö\Sample\Vfp98\Solution\Reports directory.
To set a field to stretch with its value
Controls that are placed relative to controls that stretch must be set to float or they will be overwritten.
To set a control to float
Caution Some of your data could be overwritten during printing if: (1) you position a field relative to the bottom of the band and include below this field another field that is positioned relative to the top of the band and can stretch; or (2) you position a field relative to the top of the band and include above this field another field that is positioned relative to the top of the band and can stretch.
You can also set lines, rectangles, and rounded rectangles to stretch. They can stretch relative to the band or, if part of a group of controls, they can stretch relative to the largest control in the group.
To set a line or rectangle to stretch
To print a border around a stretchable control
Selection handles appear at the corners of the rectangle. From now on you can treat all of the controls as one. The rectangle will stretch along with the stretchable field. Regardless of how far down the value in the field stretches, the rectangle will maintain its border around the field. You can place two of these groups side by side in the layout and one will not be affected by the stretching of the other.
To print one stretchable control below another
The two record values will print in their entirety and will not overwrite each other.
You can control when and how often each report control is printed in your report. For more information about a controlís print options, see Print When Dialog Box.
For field controls, you can suppress values repeated for consecutive records so that the value is printed once for the first record but doesn't appear for subsequent records until the value changes. For example, if you're printing an invoice, and one of the fields contains the date of the transaction, the date would only be printed once for transactions that took place on the same date.
To suppress repeated values
Print When dialog box
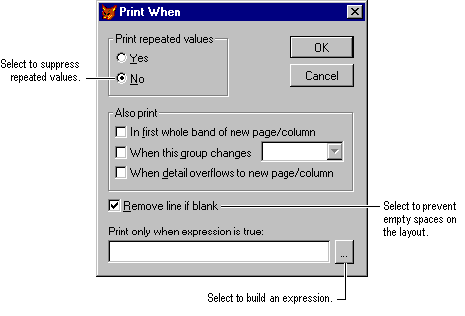
To repeat only on a new page or column
To repeat when the detail band overflows to a new page or column
You can add expressions to a control: they are evaluated before the field prints. If the expression evaluates to false (.F.), the field will not print. If you add an expression, all of the other options in the Print When dialog box are disabled except Remove Line If Blank.
For examples of Print When conditions, see the reports Colors.frx and Ledger.frx in the Visual Studio Ö\Sample\Vfp98\Solution\Reports directory.
To add a print expression
-or-
Click the dialog button to create an expression with the Expression Builder.
Your report may include records that don't contain values for every field control. By default, Visual FoxPro leaves the area for that field blank. You can remove these blank areas to create a more pleasing and continuous display of the information.
To suppress blank lines
Visual FoxPro will remove the line from the report if it evaluates to blank. If the field doesnít print or if the table field is empty, Visual FoxPro checks for other controls in the line. If none are found, the line is removed. If you don't select this option and no other controls are on the same line, a blank line is printed.
You can control how groups are printed in your report. Sometimes you may want each group to start on a separate page or you may want to control when the group header prints.
In addition to selecting the field or expression to be grouped, the Data Grouping dialog box allows you to specify page break options for groups.
You might want your groups to appear in the next column for multi-column reports, on a new page for forms, or with a new page numbered at 1. The Data Grouping dialog box offers four options to accomplish these tasks. You can:
After you enter an expression, you can select these options from the Group Properties area.
Sometimes a group may print partially on one page and then finish on the next. To avoid a group header from printing near the bottom of the page with the majority of records on the next page, you can set the minimum distance from the bottom that a group header will print. If the header would be positioned closer to the bottom of the page than the number of inches or centimeters you enter, Visual FoxPro prints the header on a new page.
To prevent orphaned group headers
Tip To determine a good value for orphan control, add the Group Header height to one to three times the Detail height.
If repeated values are suppressed, you may want them to print when a particular group changes.
To print repeated values when the group changes
The groups defined for the report appear in the box.
When a group continues onto the next page, you might want the group header to repeat at the top of the group of continued information. If you have multiple data groups on your report, the header on the subsequent pages will be from the last group in the group list. Place all of the controls you want to print for the group header in the header band of the last group on the list.
To repeat the group header on the next page
If you don't want to repeat the group header, clear this check box.
You can control where report and label output is sent by using one of these keywords with the REPORT or LABEL command:
If you don't use any keywords, the report is sent to the screen or active window.
When you print a report, you might want to limit the number of records that appear in the report by providing selection criteria. You can:
You can use any combination of these options. The WHILE expression overrides the other criteria.
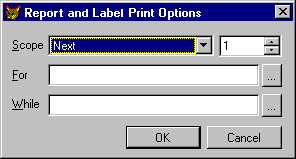
One way you can limit the number of records is to specify a quantity or range of records. Using the Scope option, you can select a single record or a group of records positioned sequentially in the file.
Note The active index and the current record pointer affect the results of the scope options Next and Rest. For example, the next record in a table indexed by last name is probably different than one in a table indexed by state. This doesn't affect the Record option because the number for a record doesn't change when the table is indexed.
To select a limited number of records
Report and Label Print Options dialog box
| To print | Choose this scope option |
| Every record from the source file | ALL |
| A range of records starting with 1 | NEXT |
| A specific record by number | RECORD |
| The current record plus all of those after it to the end of the file | REST |
Visual FoxPro prints the report using data from the records within the scope you selected.
If the records you want to select are not sequential within the table, you can build a logical expression that specifies selection criteria a record must meet to be printed. For example, you can choose to print all records with a particular value in a field.
To enter criteria for selecting records
-or-
Make sure the records sources used by the report are open, and then choose the For button to use the Expression Builder.
Note You don't need to include the FOR command in the expression. For example, type country = "Canada" to see only Canadian data.
Visual FoxPro evaluates all of the records and prints the report using those records that match the condition in the expression.
When printing, you can specify a condition that must be met to continue evaluating and selecting records. You enter this condition as a WHILE expression. As long as the WHILE expression remains true, Visual FoxPro processes the data source. After finding a record that doesn't meet the condition, Visual FoxPro ends the evaluation process and prints the selected records. This option allows you to select records based on information outside the values contained in the fields.
Tip If you use a WHILE expression on a file that hasn't been indexed, the selection process may end before evaluating all of the appropriate records. Before printing the report, be sure the source table has the appropriate index active for the WHILE expression you want to use.
To enter criteria for ending record selection
-or-
Choose the While button to use the Expression Builder.
Note You don't need to include the WHILE command in the statement. For example, type sales > 1000 to see only sales above one-thousand dollars.
Visual FoxPro prints the report using the records it evaluates while the expression is true.
If you want to send the report to the printer, you can send it directly to the printer or display the Print Setup dialog box.
To send a report to the printer
For example, the following code sends the report MyReport to the default printer and stops the report from printing on the screen:
REPORT FORM MYREPORT.FRX TO PRINTER NOCONSOLE
To display the Print Setup dialog box before sending the report to the printer
For example, the following code displays the Print Setup dialog box, sends the report MyReport to the default printer, and stops the report from printing in the active window:
REPORT FORM MYREPORT.FRX TO PRINTER PROMPT NOCONSOLE
If you want to display a preview of the report, you can send it to the Preview window in the Report Designer.
To preview a report
For example, the following code displays the report in a modal window:
REPORT FORM MYREPORT.FRX PREVIEW
By default, the Preview window is modal but allows access to the Preview toolbar. If you want to make the preview modeless, you can add the keyword NOWAIT to the REPORT command.
For example, the following code displays the report in a modeless window:
REPORT FORM MYREPORT.FRX PREVIEW NOWAIT
If you want to preview the results in a specific window, you can include the WINDOW clause to specify a window created with DEFINE WINDOW.
REPORT FORM MYREPORT.FRX PREVIEW WINDOW MYWINDOW
If you want to create an electronic version of the report, you can send it to a file formatted for your printer or to an ASCII file. Sending reports to a file allows you to print them in a batch on your printer at a later time.
If you want to create an ASCII file, you can create a file that includes only the text, dashes, and plus signs to represent lines and shapes. Font and color choices are not included. You can also specify the number of characters to place on each line and the number of lines to place on each page.
To print a report to an ASCII file
The following example defines the variables for the ASCII page, then prints a report called Myreport.frx to an ASCII file name Myfile.txt.
| Printing to an ASCII File | |
| Code | Comment |
|
Define the number of lines per page. |
|
Define the number of characters per line. |
|
Run the report. |
You can use the Save As HTML option on the File menu when creating or modifying a report to save the contents of the report as an HTML (Hypertext Markup Language) file.
To save a report as HTML
After you've created the components of your application, you can integrate them. The following illustration shows some ways you can add queries and reports to your application.
Some ways to integrate queries and reports
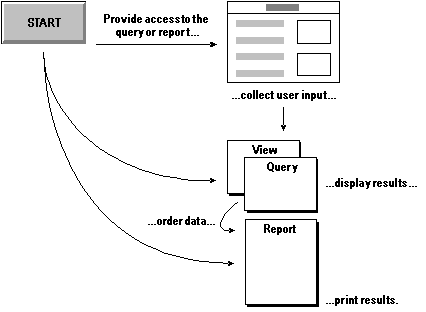
You can add code that executes a query or a report to the following objects in your application.
To add a query, view, or program
For example, add code similar to one of the following lines:
DO MYQUERY.QPR
DO MYPROGRAM.PRG
USE myview
You have several options for integrating reports into your application.
To run reports and labels
For example, you could use code similar to one of the following lines:
REPORT FORM MYREPORT.FRX
LABEL FORM MYLABEL.LBX
To modify reports and labels
For example, add code similar to one of the following lines:
MODIFY REPORT MYREPORT.FRX
MODIFY LABEL MYLABEL.LBX
To create reports and labels
For example, you could use code similar to one of the following lines:
CREATE REPORT MYREPORT.FRX
CREATE LABEL MYLABEL.LBX
If you want to collect values from a form, you can use variables in a SELECT Ė SQL statement and then use them immediately in the statement, or execute the statement later.
To collect values for immediate use, you can either explicitly name the form or use a shortcut reference for the form in your SELECT Ė SQL statement. In this example, shortcut reference is in the WHERE clause.
Collecting Values Using Shortcut References in a SELECT - SQL Statement
| Code | Comment |
|
Use THISFORM as a shortcut reference for the currently active form and substitute control names for ControlName1 and ControlName2. |
If you don't want to use references to the control, you can define variables in the code. Use code variables if you want to store the values from a form but don't necessarily expect to use them while the form is active.
Collecting Values for Later Use
| Code | Comment |
|
Define the variable. |
|
Use the variable you defined in the SELECT - SQL statement. |
If you don't define the variable before you run the query, an error message appears stating that the variable couldn't be found. If the variable isn't defined in code, Visual FoxPro assumes that the variable is pre-initialized.