Testing involves finding problems in your code; debugging consists of isolating and fixing the problems. Testing and debugging are necessary stages in the development cycle, and they are best incorporated early in the cycle. Thoroughly testing and debugging individual components makes testing and debugging integrated applications much easier.
For more information about creating an application, see Chapter 2, Developing an Application, and Chapter 13, Compiling an Application.
This chapter discusses:
Typically, developers look for different levels of robustness as they are testing and debugging their applications:
Visual FoxPro provides a rich set of tools to help you isolate and identify the problems in your code so that you can fix them effectively. However, one of the best ways to create a robust application is to look for potential problems before they occur.
Studies have shown that good coding practices (using white space, including comments, adhering to naming conventions, and so on) automatically tend to reduce the number of bugs in your code. In addition, there are some steps you can take early in the development process to make testing and debugging easier later on, including:
The system environment that you expect an application to run in is as important as the data environment you have set up for the application itself. To ensure portability and to create an appropriate context for testing and debugging, you need to consider the following:
For maximum portability, you should develop applications on the lowest common platform you expect them to run on. To establish a baseline platform:
To ensure all necessary program files are readily accessible on each machine that will run your application, you might also require a baseline file configuration. To help you define a configuration baseline, answer the following questions:
Directory Structure and File Locations
If your source code references absolute paths or file names, those exact paths and files must exist when your application is installed on any other computer. To avoid this scenario, you can:
You can include asserts in your code to verify assumptions you have about the run-time environment for the code.
To set an assert
When the condition stipulated in the ASSERT command evaluates to false (.F.), an assert message box is displayed and echoed to the Debug Output window.
For example, you could be writing a function that expects a non-zero parameter value. The following line of code in the function alerts you if the value of the parameter is 0:
ASSERT nParm != 0 MESSAGE "Received a parameter of 0"
You can specify whether assert messages are displayed with the SET ASSERTS command. By default, assert messages are not displayed.
When you see events occur in relation to other events, you can determine the most efficient place to include your code.
To track events
-or-
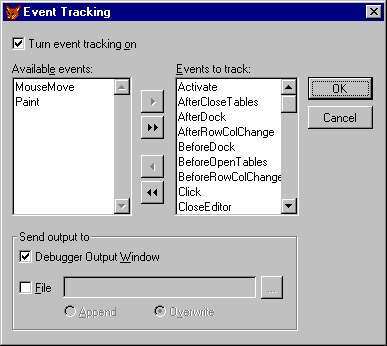
The Event Tracking Dialog Box allows you to select the events that you want to see.
Event Tracking Dialog Box

Note In this example, the MouseMove and Paint events have been removed from the Events to track list because these events occur so frequently that they make it more difficult to see the sequences of the other events.
When event tracking is enabled, every time a system event in the Events to track list occurs, the name of the event is displayed in the Debug Output window or written to a file. If you choose to have the events displayed in the Debug Output window, you can still save them to a file as described in Displaying Output later in this chapter.
Note If the Debug Output window is not open, events will not be listed, even if the Debugger Output Window box is set.
Once your testing has identified problems, you can use the Visual FoxPro debugging environment to isolate those problems by:
You start a debugging session by opening the debugging environment.
To open the debugger
Note If you're debugging in the Visual FoxPro environment, choose the debugging tool you want to open from the Tools menu.
You can also open the debugger with any of the following commands:
The debugger opens automatically whenever a breakpoint condition is met.
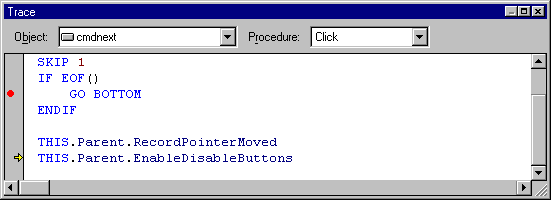
One of the most useful debugging strategies at your disposal is the ability to trace through code, see each line of code as it executes, and check the values of all variables, properties, and environment settings.
Code in the Trace window
To trace through code
An arrow in the gray area to the left of the code indicates the next line to execute.
Tips The following tips apply:
If you isolate a problem when you're debugging a program or object code, you can immediately fix it.
To fix problems encountered while tracing code
When you choose Fix from the Debug menu, program execution is canceled and the code editor is opened to the location of the cursor in the Trace window.
Breakpoints allow you to suspend program execution. Once program execution has been suspended, you can check the values of variables and properties, see environment settings, and examine sections of code line by line without having to step through all your code.
Tip You can also suspend execution of a program running in the Trace window by pressing ESC.
You can set breakpoints in your code to suspend program execution in several different ways. If you know where you want to suspend program execution, you can set a breakpoint directly on that line of code.
To set a breakpoint on a particular line of code
In the Trace window, locate the line of code you want to set the breakpoint on and do one of the following:
-or-
A solid dot is displayed in the gray area to the left of the line of code to indicate that a breakpoint has been set on that line.
Tip If you are debugging objects, you can locate particular lines of code in the Trace window by choosing the object from the Object list and the method or event from the Procedure list.
You can also set breakpoints by specifying locations and files in the Breakpoints dialog box.
Breaking at a location
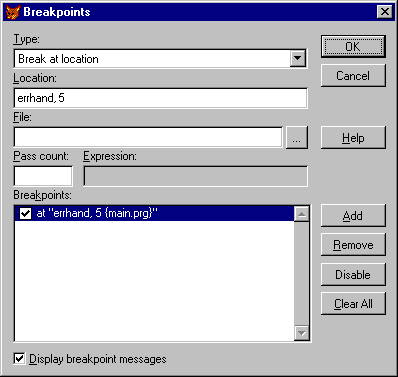
Examples of Locations and Files for Breakpoints
| Location | File | Where execution suspends |
|
C:\Myapp\Main.prg | The first executable line in a procedure named ErrHandler in Main.prg. |
|
C:\Myapp\Main.prg | The tenth line in the program named Main. |
|
C:\Myapp\Form.scx | The first executable line of any procedure, function, method or event named Click in Form.scx. |
|
C:\Myapp\Form.scx | The first executable line associated with the Click event of cmdNext in Form.scx. |
|
The first executable line in the Click event of any control whose ParentClass is cmdNext in any file. |
If you want to know when the value of a variable or property changes, or when a run-time condition changes, you can set a breakpoint on an expression.
Breaking when an expression changes
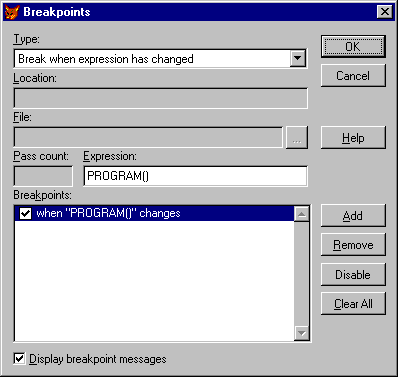
To suspend program execution when the value of an expression changes
Examples of breakpoint expressions
| Expression | Use |
|
Suspend execution when the record pointer moves in the table. |
|
Suspend execution on the first line of any new program, procedure, method, or event. |
|
Suspend execution any time the value of this property is changed interactively or programmatically. |
Often you’ll want to suspend program execution, not at a particular line, but when a certain condition is true.
Breaking on an expression
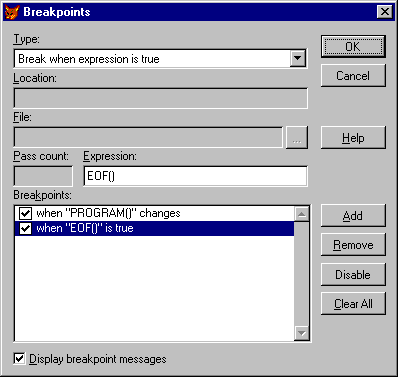
To suspend program execution when an expression evaluates to true
Examples of breakpoint expressions
| Expression | Use |
|
Suspend execution when the record pointer has moved past the last record in a table. |
|
Suspend execution on the first line of code associated with a Click or DblClick event. |
|
If the return value of a message box is stored to nReturnValue, suspend execution when a user chooses Yes in the message box. |
You can specify that program execution be suspended at a particular line only when a particular condition is true.
Breaking when an expression is true
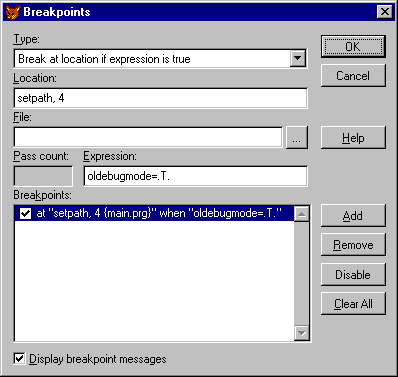
To suspend program execution at a particular line when an expression evaluates to true
Tip It is sometimes easier to locate the line of code in the Trace window, set a breakpoint, and then edit that breakpoint in the Breakpoints dialog box. To do this, change the Type from Break at location to Break at location if expression is true and then add the expression.
You can disable breakpoints without removing them in the Breakpoints dialog box. You can delete “break at location” breakpoints in the Trace window.
To remove a breakpoint from a line of code
In the Trace window, locate the breakpoint and do one of the following:
-or-
In the Debugger window, you can easily see the run-time values of variables, array elements, properties, and expressions in the following windows:
The Locals window displays all the variables, arrays, objects, and object members that are visible in any program, procedure, or method on the call stack. By default, values for the currently executing program are displayed in the Locals window. You can see these values for other programs or procedures on the call stack by choosing the programs or procedures from the Locals For list.
Locals window

You can drill down into arrays or objects by clicking the plus (+) beside the array or object name in the Locals and Watch windows. When you drill down, you can see the values of all the elements in the arrays and all the property settings in objects.
You can even change the values in variables, array elements, and properties in the Locals and Watch windows by selecting the variable, array element, or property, clicking in the Value column, and typing a new value.
In the Watch box of the Watch window, type any valid Visual FoxPro expression and press ENTER. The value and type of the expression appears in the Watch window list.
Watch window

Note You can’t enter expressions in the Watch window that create objects.
You can also select variables or expressions in the Trace window or other Debugger windows and drag them into the Watch window.
Values that have changed are displayed in red in the Watch window.
To remove an item from the Watch window list
Select the item and choose one of the following:
-or-
To edit a watch
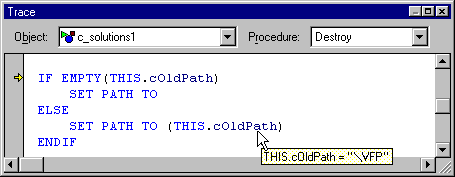
Position the cursor over any variable, array element, or property in the Trace window to display its current value in a value tip.
A value tip in the Trace window
The DEBUGOUT command allows you to write values in the Debug Output window to a text file log. Alternatively, you can use the SET DEBUGOUT TO command or the Debug tab of the Options dialog box.
If you aren't writing DEBUGOUT commands to a text file, the Debug Output window must be open in order for the DEBUGOUT values to be written. The following line of code prints in the Debug Output window at the time that the line of code executes:
DEBUGOUT DATETIME( )
In addition, you can enable event tracking, described earlier in this chapter, and choose to have the name and parameters of each event that occurs displayed in the Debug Output window.
Later in the development process, you might want to refine your code for performance and ensure that you've adequately tested the code by logging code coverage information.
Code coverage gives you information about which lines of code have been executed and how long it took to execute them. This information can help you identify areas of code that aren’t being executed and therefore aren’t being tested, as well as areas of the code that you may want to fine tune for performance.

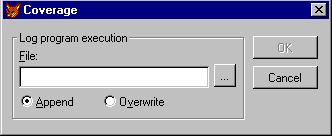
You can toggle code coverage on and off by clicking the Code Coverage toolbar button in the Debugger window. If you toggle code coverage on, the Coverage dialog box opens so that you can specify a file to save the coverage information to.
Coverage Dialog Box
You can also toggle coverage logging on and off programmatically by using the SET COVERAGE TO command. You could, for example, include the following command in your application just before a piece of code you want to investigate:
SET COVERAGE TO mylog.log
After the section of code you want to log coverage for, you could include the following command to set code coverage off:
SET COVERAGE TO
When you've specified a file for the coverage information, switch to the main Visual FoxPro window and run your program, form, or application. For every line of code that is executed, the following information is written to the log file:
The easiest way to extract information from the log file is to convert it into a table so that you can set filters, run queries and reports, execute commands, and manipulate the table in other ways.
The Coverage Profiler application creates a cursor from the data generated in coverage logging and uses this cursor in a window for easy analysis.
The following program converts the text file created by the coverage log into a table:
cFileName = GETFILE('DBF')
IF EMPTY(cFileName)
   RETURN
ENDIF

CREATE TABLE (cFileName) ;
   (duration n(7,3), ;
   class c(30), ;
   procedure c(60), ;
   line i, ;
   file c(100))

APPEND FROM GETFILE('log') TYPE DELIMITED
Run-time errors occur after the application starts to execute. Actions that would generate run-time errors include: writing to a file that doesn’t exist, attempting to open a table that is already open, trying to select a table that has been closed, encountering a data conflict, dividing a value by zero, and so on.
The following commands and functions are useful when anticipating and managing run-time errors.
| To | Use |
| Fill an array with error information | AERROR( ) |
| Open the Debugger or Trace window | DEBUG or SET STEP ON |
| Generate a specific error to test your error handling | ERROR |
| Return an error number | ERROR( ) |
| Return an executing program line | LINENO( ) |
| Return an error message string | MESSAGE( ) |
| Execute a command when an error occurs | ON ERROR |
| Return commands assigned to error handling commands | ON( ) |
| Return the name of the currently executing program | PROGRAM( ) OR SYS(16) |
| Re-execute the previous command | RETRY |
| Return any current error message parameter | SYS(2018) |
The first line of defense against run-time errors is anticipating where they could occur and coding around them. For example, the following line of code moves the record pointer to the next record in the table:
SKIP
This code works unless the record pointer is already past the last record in the table, at which point an error will occur.
The following lines of code anticipate this error and avoid it:
IF !EOF()
   SKIP
      IF EOF()
         GO BOTTOM
      ENDIF
ENDIF
As another example, the following line of code displays the Open dialog box to allow a user to open a table in a new work area:
USE GETFILE('DBF') IN 0
The problem is that the user could choose Cancel in the Open dialog box or type the name of a file that doesn’t exist. The following code anticipates this by making sure that the file exists before the user tries to use it:
cNewTable = GETFILE('DBF')
IF FILE(cNewTable)
   USE (cNewTable) IN 0
ENDIF
Your end user may also type the name of a file that isn’t a Visual FoxPro table. To circumvent this problem, you could open the file with low-level file I/O functions, parse the binary header, and make sure that the file is indeed a valid table. However, this would be a bit of work and it might noticeably slow down your application. You would be better off handling the situation at run time by displaying a message like “Please open another file. This one is not a table” when error 15, “Not a table,” occurs.
You can’t, and probably don’t want to, anticipate all possible errors, so you'll need to trap some by writing code to be executed in the event of a run time error.
When an error occurs in procedural code, Visual FoxPro checks for error-handling code associated with an ON ERROR routine. If no ON ERROR routine exists, Visual FoxPro displays the default Visual FoxPro error message. For a complete list of Visual FoxPro error messages and error numbers, see Help.
You can include any valid FoxPro command or expression after ON ERROR, but normally you call an error-handling procedure or program.
To see how ON ERROR works, you can type an unrecognizable command in the Command window, such as:
qxy
You’ll get a standard Visual FoxPro error message dialog box saying “Unrecognized command verb.” But if you execute the following lines of code, you’ll see the error number, 16, printed on the active output window instead of the standard error message displayed in a dialog box:
ON ERROR ?ERROR()
qxy
Issuing ON ERROR with nothing after it resets the built-in Visual FoxPro error messaging:
ON ERROR
In skeletal form, the following code illustrates an ON ERROR error handler:
LOCAL lcOldOnError

* Save the original error handler
lcOldOnError = ON("ERROR")

* Issue ON ERROR with the name of a procedure
ON ERROR DO errhandler WITH ERROR(), MESSAGE()

* code to which the error handling routine applies

* Reset the original error handler
ON ERROR &lcOldOnError

PROCEDURE errhandler
LOCAL aErrInfo[1]
AERROR(aErrInfo)
DO CASE
   CASE aErrInfo[1] = 1 && File Does Not Exist
      * display an appropriate message
      * and take some action to fix the problem.
   OTHERWISE
      * display a generic message, maybe
      * send high priority mail to an administrator
ENDPROC
When an error occurs in method code, Visual FoxPro checks for error-handling code associated with the Error event of the object. If no code has been written at the object level for the Error event, the Error event code inherited from the parent class, or another class up the class hierarchy, is executed. If no code has been written for the Error event anywhere in the class hierarchy, Visual FoxPro checks for an ON ERROR routine. If no ON ERROR routine exists, Visual FoxPro displays the default Visual FoxPro error message.
The beauty of classes is that you can encapsulate everything a control needs, including error handling, so that you can use the control in a variety of environments. Later, if you discover another error the control might encounter, you can add handling for that error to the class, and all objects based on your class will automatically inherit the new error handling.
For example, the vcr class in the Buttons.vcx class library, located in the Visual Studio …\Samples\Vfp98\Classes directory, is based on the Visual FoxPro container class.

Four command buttons in the container manage table navigation, moving the record pointer in a table with the following commands:
GO TOP
SKIP - 1
SKIP 1
GO BOTTOM.
An error could occur when a user chooses one of the buttons and no table is open. Visual FoxPro attempts to write buffered values to a table when the record pointer moves. So an error could also occur if optimistic row buffering is enabled and another user has changed a value in the buffered record.
These errors could occur when the user chooses any one of the buttons; therefore, it doesn’t make sense to have four separate error handling methods. The following code associated with the Error event of each of the command buttons passes the error information to the single error-handling routine of the class:
LPARAMETERS nError, cMethod, nLine
THIS.Parent.Error(nError, cMethod, nLine)
The following code is associated with the Error event of the vcr class. The actual code differs because of coding requirements for localization.
Parameters nError, cMethod, nLine
DO CASE
CASE nError = 13 && Alias not found
   cNewTable = GETFILE('DBF')
   IF FILE(cNewTable)
      SELECT 0
      USE (cNewTable)
      This.SkipTable = ALIAS()
   ELSE
      This.SkipTable = ""
   ENDIF
CASE nError = 1585 && Data Conflict
* Update conflict handled by a datachecker class
   nConflictStatus = ;
      THIS.DataChecker1.CheckConflicts()
   IF nConflictStatus = 2
      MESSAGEBOX "Can't resolve a data conflict."
   ENDIF
OTHERWISE
* Display information about other errors.

   cMsg="Error:" + ALLTRIM(STR(nError)) + CHR(13) ;
      + MESSAGE()+CHR(13)+"Program:"+PROGRAM()

   nAnswer = MESSAGEBOX(cMsg, 2+48+512, "Error")
   DO CASE
      CASE nAnswer = 3   &&Abort
         CANCEL
      CASE nAnswer = 4   &&Retry
         RETRY
      OTHERWISE       && Ignore
         RETURN
   ENDCASE
ENDCASE
You want to make sure that you supply information for an error that you haven’t handled. Otherwise, the error event code will execute but won’t take any actions, and the default Visual FoxPro error message will no longer be displayed. You, as well as the user, won’t know what happened.
Depending on your target users, you might want to supply more information in the case of an unhandled error, such as the name and phone number of someone to call for help.
After the error handling code executes, the line of code following the one that caused the error is executed. If you want to re-execute the line of code that caused the error after you've changed the situation that caused the error, use the RETRY command.
Note The Error event can be called when the error encountered wasn’t associated with a line of your code. For example, if you call a data environment’s CloseTables method in code when AutoCloseTables is set to true (.T.) and then release the form, an internal error is generated when Visual FoxPro tries to close the tables again. You can trap for this error, but there is no line of code to RETRY.